Cuba La Cueva - 3D Model
This case study will show some simple visualization techniques that can be accomplished entirely with Microstation and a few plugins and images for texture maps. The model is based on a road design file for a remote valley in New Mexico. One of the other case studies shows photosims produced for this location.
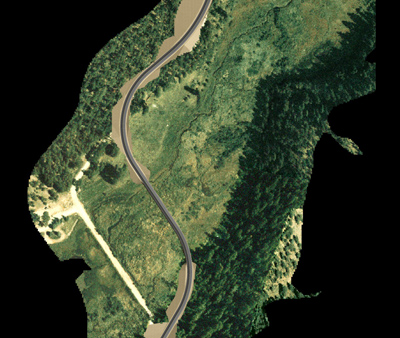
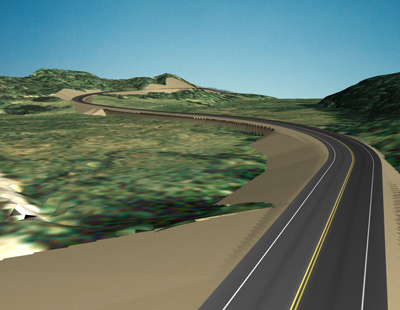
By 'draping' a georeferenced aerial photo onto the terrain model (the TIN data set), and adding some textures to the new road elements, a reasonable visualization can be produced. This kind of visualization is especially useful for illustrating the layout and cut/fill locations for a roadway alignment, and potential visibility of the cuts and fills from different eye-level locations.
The Surface Modeling Process
The roadway and surrounding terrain was surfaced using tools described in Creating Surfaces from Road Designs and Advanced 3D Objects. Two surfaces were produced from the roadway design file- one which included the cut and fill slopes, and one which included only the two-lane paved surface. This way, a paving/striping texture map could be applied to the road, and a dirt surface to the cut/fill slopes. The surrounding terrain was surfaced using DTM tools, with the new road cut/fill surfaces 'cut out' of the overall surface, then the aerial photo was draped over it using the texture mapped materials described in Advanced Materials and Lighting.
The Terrain Model
First, a smaller area is clipped out of the overall project TIN to simplify the model. The Build Clip TIN tool is found with the Build Triangles button on the DTM menu: Applications>GEOPAK ROAD>DTM Tools. An input TIN file and a target output TIN file are selected, then a polygon is drawn and selected for the clip. Setting External clips everything outside the polygon.
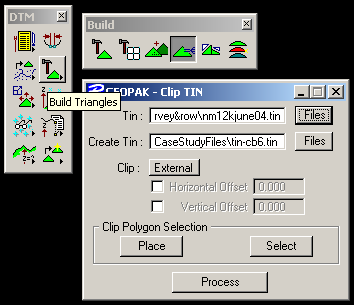
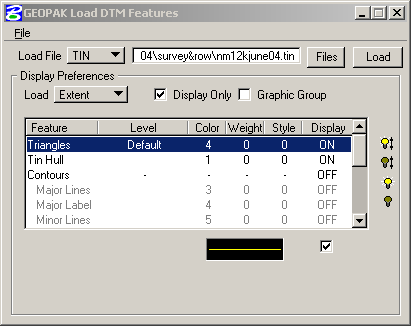
The Load DTM Features tool, also on the DTM toolbar, can be used to display the original TIN to help draw the clipping polygon by checking the Display Only box.
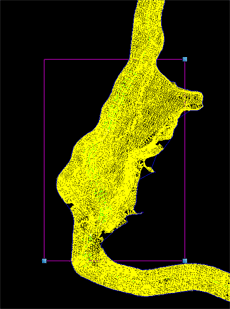
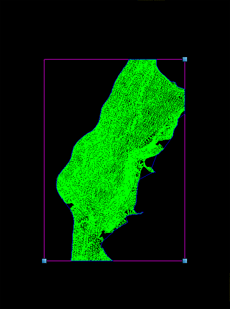
The images below show the TIN before and after clipping.
The new TIN can be converted to geometry with the Load DTM Features Tool, this time Display Only is unchecked, and a Level is chosen with the symbology settings at the bottom of the dialog.
Using the Elevation drape pattern described in Advanced Materials and Lighting, we can place the aerial image for the site onto the terrain model. In the pattern definition for the material, the size and offset are set based on the image dimensions and origin from the Raster Manager or Descartes.
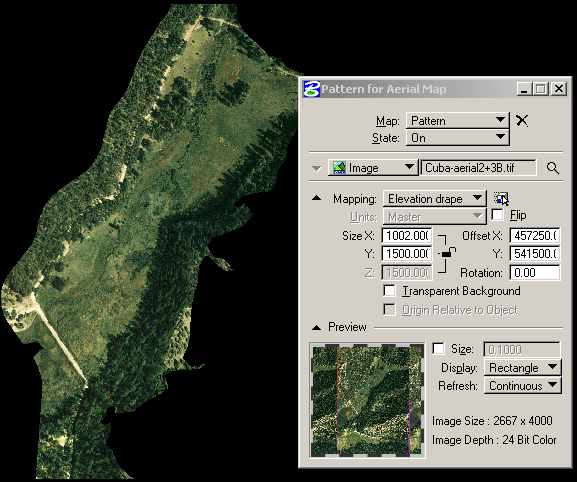
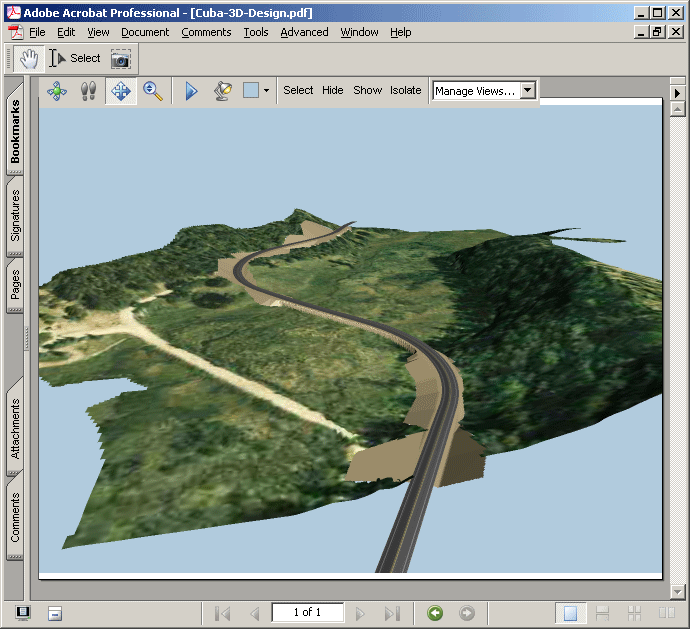
This model was used to produce the 3D PDF (requires Adobe Acrobat) shown above.
The Cut and Fill Slopes
The slopes did not need to be as precise as the road surface, and were textured with a pattern that could be 'tiled' in any direction. The slopes were generated using the 3D Modeling tools described in Creating Surfaces from Road Designs, and turned into a lattice using tools described in Advanced 3D Objects. Turning the surface into a lattice creates a smoother and more uniform surface. Once a 3D version of the slopes was produced, a 'hull' or boundary for the outer edge of the surfaces is generated, and this polygon can be used to clip triangles out of the terrain model for the site- otherwise the cuts would not be visible as they are lower in elevation than the existing terrain.
Following the steps outlined, the first step is to create the 3D alignment. Then generate the 3D cross sections. This is where problems with symbology selection or the 2D cross section may occur. The 3D sections should be complete and regular.
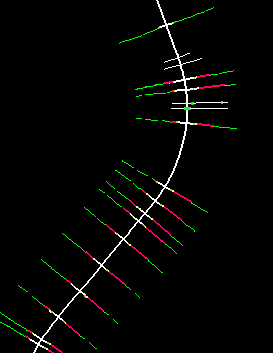
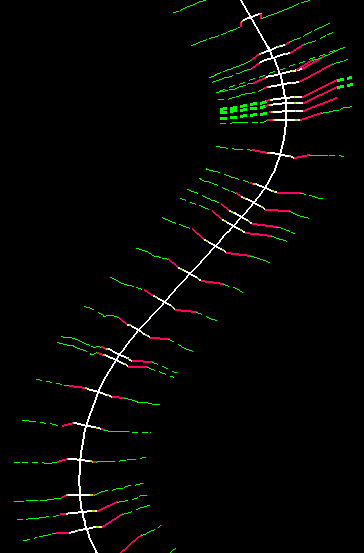
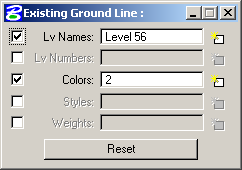
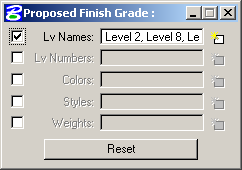
Usually just getting the levels and colors right for section details is enough to get the 3D sections to work. For this project, the Existing Ground Line was specified with Level 56 and Color 2, as there were other colors on level 56 to be filtered out. The Proposed Finish Grade was defined with levels only: 2,8 and 10. Just enough symbology to make the 2D section information unique is necessary.
Only a short section of the overall roadway was used for this model, setting station limits in the 3D sections dialog will control how many sections are generated:

Once 3D sections have been generated successfully, the next step is to begin creating surfaces. It is best to proceed with small sections at a time, debugging and filling in holes along the way. Sometimes it is necessary to edit the 2D sections and redraw 3D sections to get the surfaces to work.
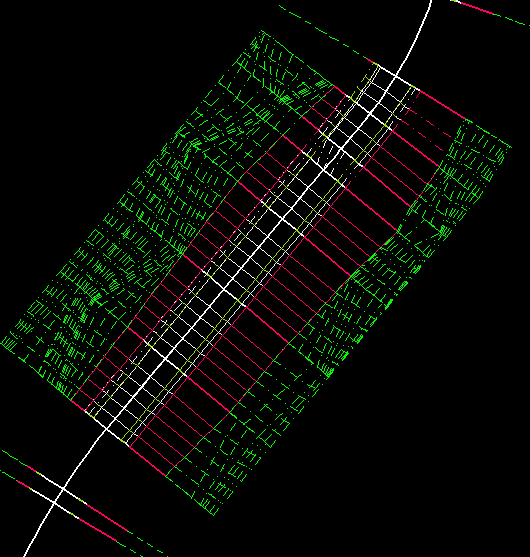
The sections are turned into surfaces a few at a time, as described in Creating Surfaces from Road Designs, snapping DP's to endpoints of the 3D sections:
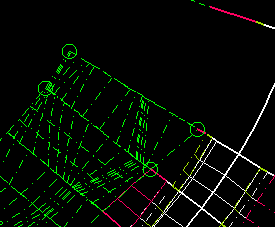
Sometimes individual surfaces need to be defined between 2 section lines if they do not generate with larger selections. This individual green section can be built by snapping to DP's on the 4 edges of the sections:
A last resort to filling in surfaces that won't connect is to build them in Microstation with the Surface by Network tool. This is described in Advanced 3D Objects.
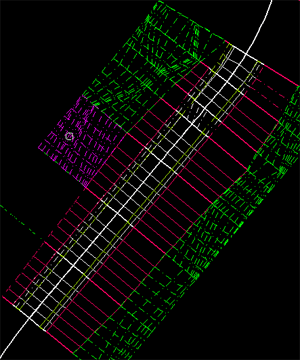
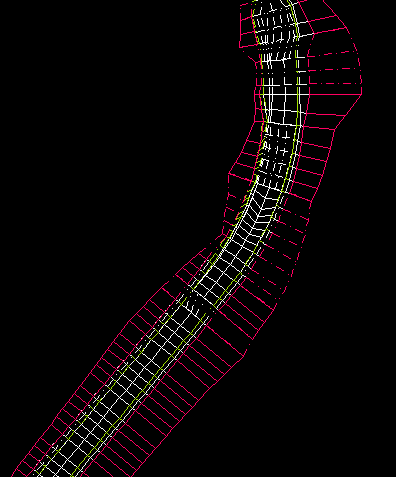
Only the cut and fill slopes were needed for this model, so once the surfaces were created, the existing portion of the surfaces were deleted. In the Cuba La Cueva model these were the green surfaces. Because the surfaces were created from separate section lines and colors, they can be deleted as discreet elements.
Turning the Surfaces into a Lattice
Lattices produce more even surfaces and tend to render more smoothly than TINs or Geopak 3D Models. they also are easier to read in wireframe mode. The Cut and fill slopes were tuned into a .5M x .5M lattice for this model. The first step is to convert the 3D surfaces into a DAT file. This is slightly different than converting directly to a DAT using the DTM tools as these surfaces include interpolated data between the 3D sections. Using the extract DTM tool, the surfaces are converted to 3D data. The tool gets 3d information from each vertex in the model. The tool can be used to convert any type of Microstation 3D feature.
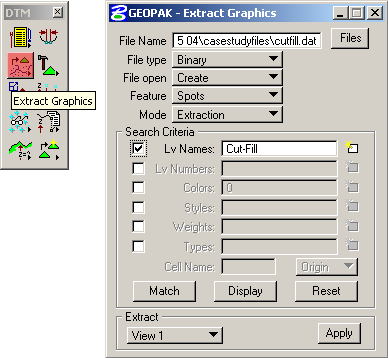
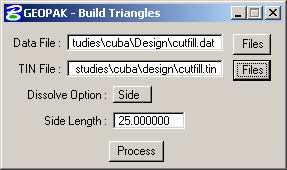
Here the tool is set up to extract point data from a specific level, and create a DAT file. The DAT file can then be converted into a TIN file using the build triangles tool. Here we need to be careful with the Dissolve Option. Using the Side option with a length that is longer than the typical section spacing from the Geopak design will eliminate most long slivered edge triangles. The spacing in the model is 20M, so a Side Length of 25M works well:
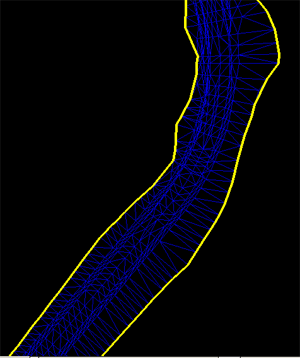
This TIN can be displayed (or converted to geometry) before continuing. The following image shows the TIN and the Hull for this TIN (in Yellow). The Hull polygon will be useful for clipping out sections of the terrain model.
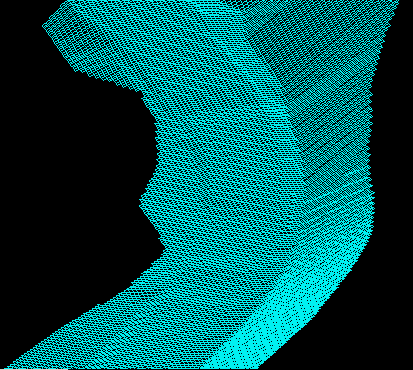
Next, the TIN is converted into a Lattice. The Interval, or grid cell size, is set to 1Mx1M:
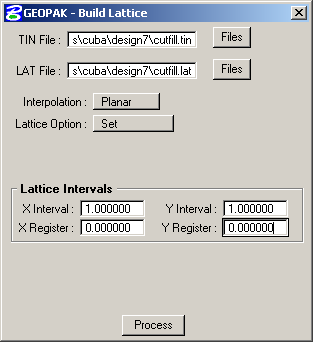
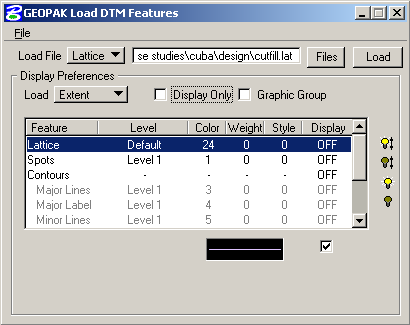
Next, the Lattice is loaded in a similar way as other 3D data, with the Load DTM tool. The level and symbology for the lattice is defined with the button at the bottom.
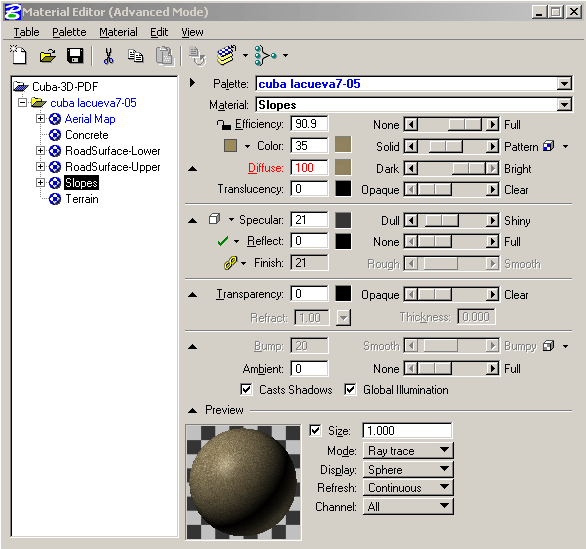
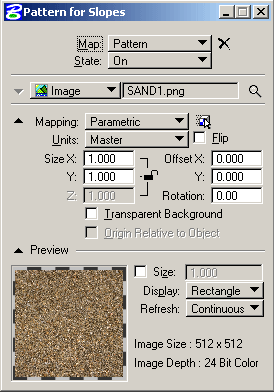
A tan dirt material was applied to the Cut-Fill surfaces. The material uses a 'tileable' texture that is mixed with a color and repeated across the surface. The material is applied as a parametric mapped texture in master units (1Mx1M). The texture map is mixed at 90% with a tan color to soften the effect of the low resolution. See Advanced Materials and Lighting for more about materials.
The Road Model
The road surface portion of this model was built separately to accommodate a texture map that would show the asphalt surface and pavement markings. The texture map needed to be aligned along the surface of the road as it followed the curving centerline. By snapping the DP settings for the surfacing tool to just the road surface section, a 3D model of the road only was created.
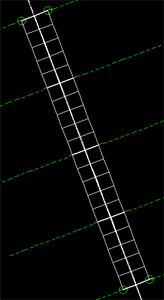
A texture map of a paved road surface with lines could then be applied as outlined in Advanced Materials and Lighting. The material was applied to individual elements as each side of the road required a different texture.
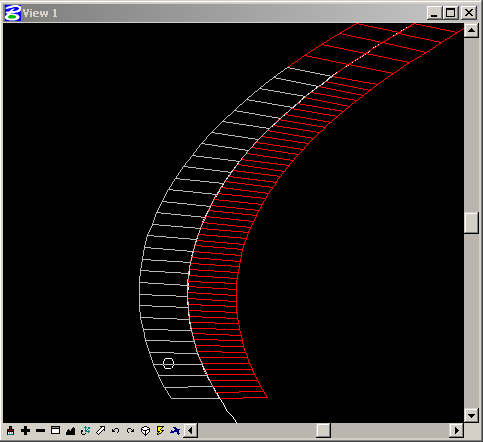
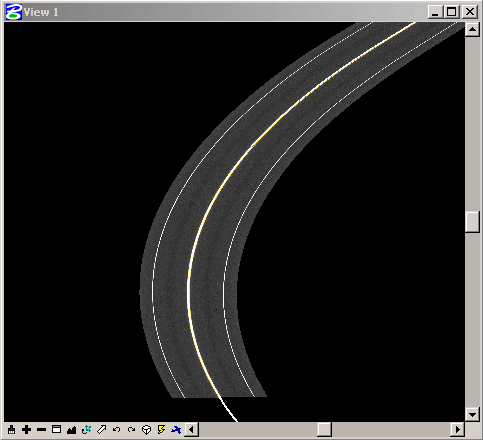
The road surface was moved up a few inches so as not to interfere with the cut/fill surfaces. The two surfaces were produced from the same road surface section segments.
Clipping the Cut/Fill Area Out
The last step was to remove the existing surface inside the bounding polygon for the Cut-Fill surfaces. In some cases the existing terrain would be above a cut surface and would conflict. The Build Clip TIN Tool is used again, this time with the polygon generated as the Hull for the Cut-Fill TIN. The clip is set to Internal, which deletes all points inside the polygon.

The new TIN is then surfaced using the Load DTM tool. On the left below is the bounding polygon for the Cut-Fill area, on the right is the clipped TIN.
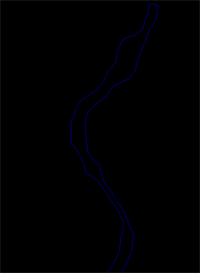
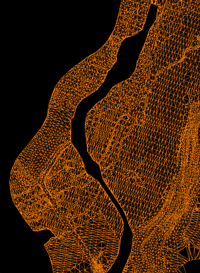
In the final model used throughout the guide, the terrain model was turned into a lattice with a 2M grid cell, and cells were deleted manually using the Cut-Fill surfaces as a guide. This way more of the 'holes' along the seam between the two surfaces could be avoided.
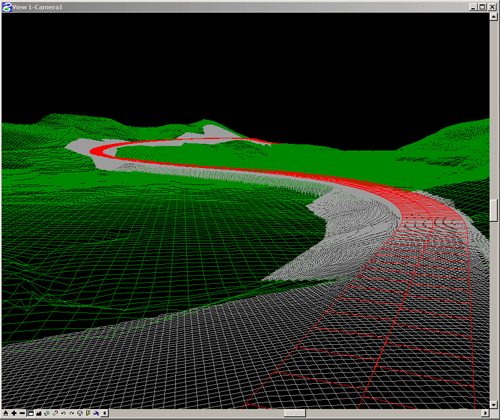
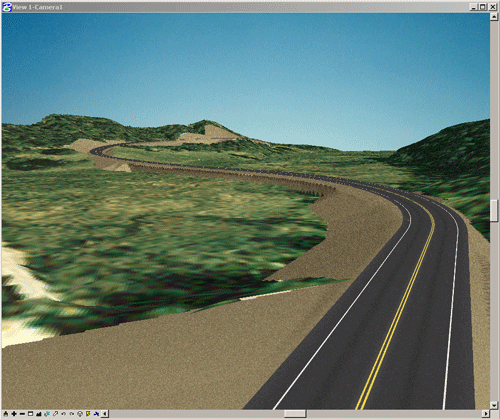
PDF File of the Finished Model
The 3D model was exported as a PDF as described in Basic Innovative Techniques. The image below links to the PDF. Adobe Reader 7 is required to view the file.
