
USA Banner

Official US Government Icon

Official websites use .gov
A .gov website belongs to an official government organization in the United States.

Secure Site Icon

Secure .gov websites use HTTPS
A lock ( ) or https:// means you’ve safely connected to the .gov website. Share sensitive information only on official, secure websites.

U.S. Department of Transportation U.S. Department of Transportation Icon United States Department of Transportation United States Department of Transportation

Noteworthy Practices

Left Nav - HSA Learn Safety

Illinois Develops SPFs for All State Routes and Intersections

Original publication: HSIP Noteworthy Practice Series, HSIP Project Identification; FHWA-SA-11-02; 2011(PDF, 2.7MB)


While the development of SafetyAnalyst and the Highway Safety Manual was still underway, Illinois decided to incorporate a new analysis technique to assist the state in moving forward with the implementation of SafetyAnalyst. Within a year, the Illinois Department of Transportation (IDOT), with the assistance of the University of Illinois, developed safety performance functions (SPF) for state routes and intersections throughout the state using the Empirical Bayes (EB) method. The SPFs have been used in the HSIP network screening process since 2008 to identify potential locations for safety improvement projects.

SPF equations were developed for 12 peer groups of roadway segments (e.g., rural two-lane highway, rural multilane undivided highway, rural multilane divided highway, etc.) and eight peer groups for intersections (e.g., rural minor leg stop control, rural all-way stop control, rural signalized, etc.). The SPFs are used in the network screening process to calculate a Potential for Safety Improvement (PSI) for all locations. The PSI is the difference between the corrected crash frequency (calculated using the EB method) and the expected crash experience (based on the SPF) for a given traffic volume within the peer group.

Since the focus of the HSIP is to reduce fatalities and serious injuries, the PSI calculation is weighted to emphasize the most severe crashes. The weighted PSI calculations are then ranked in ascending order by location and peer group to identify locations with the greatest safety need or highest PSI value. Once the sites with the greatest potential for safety improvement are identified, the IDOT Districts review the locations and make recommendations for improvement. Candidate HSIP projects on the state roadway system are selected by the District’s Safety Committee and submitted to the Bureau of Safety Engineering.

When the SPFs were originally developed, there was not enough data to develop SPFs for the local roadway system. Illinois has been expanding the crash database for local roadways and, in the near future, the state will begin discussions about the development of SPFs for local roadways, as well as updating the existing SPFs for state roadways. Currently, local roadways are evaluated using an aggregate level analysis to identify potential safety issues (e.g., counties with overrepresentation of a particular crash type, crash severity, behavioral issue, etc.). Local agencies can submit safety improvement projects to the State Safety Committee for funding consideration through the Local Road Program component of the HSIP.
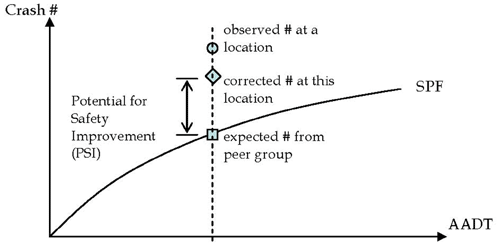
"Graph of a sample SPF curve used in the network screening process to calculate a Potential for Safety Improvement, which is the difference between the corrected crash frequency (calculated using the EB method) and the expected crash experience (based on the SPF) for a given traffic volume within the peer group"

Key Accomplishments

  • Developed SPFs for state routes and intersections throughout the state.
  • Expanded knowledge and acceptance of analysis techniques.
  • Provided data-driven safety decision making tools.

Results

Incorporating SPFs into the network screening process for safety improvement projects has led to several positive outcomes. Although other factors may involved, Illinois has seen a significant reduction in fatalities. In 2009, Illinois had the lowest number of fatalities since 1921. Transportation professionals are embracing the analysis results and making data-driven safety decisions. Using SPFs has helped shift the focus of the state’s program away from the urban, densely populated areas and provided a broader focus for safety projects, including low-cost safety improvements or systemic improvements that may not have been identified using previous analysis methods. Engineers throughout the state have become more familiar and comfortable with the use of SPFs through the state’s efforts, leading to a greater acceptance of SPFs and appreciation for improved quantitative data.

Contact

Roseanne Nance
Illinois Department of Transportation
217-785-5875
nancer@dot.il.gov
Collaborative Process Improves Work Zone Safety

Original publication: SHSP Implementation Process Model, Supplement Number 1 – Case Studies; FHWA-SA-10-025; 2010(PDF, 1MB)


Key Accomplishments

  • Developed collaborative process for safety planning focused on work zones.
  • Increased consideration of safety in work zone design.

Work zones are often high-crash locations, and many of the crashes in work zones involve commercial vehicles. Enforcement can be challenging, especially if the work zones are not designed to accommodate enforcement activities. For example, if the work zone covers a long stretch of road, law enforcement officers may not have adequate room to safely pull vehicles over.

Ohio’s SHSP identified work zone safety as an emphasis area. A team consisting of engineers, law enforcement officers, and Motor Carrier Safety Assistance Program (MCSAP) personnel was formed to better understand the issue of work zone safety. This Work Zone Safety Team collaborated with key agencies to discuss issues, pool resources, target efforts, and develop a comprehensive work zone safety plan.

To improve work zone safety performance, the Team develops a comprehensive plan to improve safety and enable improved enforcement for all work zones scheduled by the Ohio Department of Transportation (ODOT) each year. This multiagency effort incorporates resources and input from the highway patrol, engineering, MCSAP, and the Ohio Traffic Safety Office. The group works together to identify work zone areas to target with increased enforcement and inspection efforts. The highway patrol identified appropriate locations for speed enforcement. MCSAP provided truck enforcement and truck inspection support. In some cases, the Department of Public Safety used §402 funds to provide additional non truck-related enforcement. The Team also provides construction zone signage information to improve safety and aid enforcement efforts.

Results

The Work Zone Safety Team now conducts annual strategic planning related to safety in and around work zones. As a result, the ODOT engineering department has changed its construction zone design practices to better accommodate trucks. The department also has adopted practices that better accommodate enforcement activities in its work zones.

Contact:
Michelle May
Safety Program Manager
Ohio DOT
614-644-8309
Michelle.May@dot.state.oh.us

Tracking Local Project Implementation

Original publication: SHSP Implementation Process Model, Supplement Number 1 – Case Studies; FHWA-SA-10-025; 2010(PDF, 1MB)


Key Accomplishment

  • Developed a database enabling ODOT to track implementation of district safety countermeasures by location.

Ohio’s SHSP includes an emphasis area focused on the reduction of fixed-object, intersection, cross-median, and head-on crashes. Strategies include identifying locations with high numbers of such crashes and making safety improvements to them. To monitor project implementation, the Ohio Department of Transportation (ODOT) developed a formal process to track district-level progress on safety projects, countermeasures, and studies.

ODOT monitors district performance via the Safety and Congestion Work Plan. The database supporting the Work Plan includes recommended low- and moderate-cost countermeasures for specific locations. It also provides fields for estimated and actual costs, estimated and actual start date, estimated and actual completion date, progress, and crashes over the past three years. If a project milestone is not met, the project appears on a past due list. Project locations are populated by ODOT, and county managers provide status updates on countermeasures for each location.

Results

The project tracking tool has enabled ODOT to closely monitor safety project implementation in the districts. The system has been effective in informing ODOT of project delays and backlogs so issues can be addressed quickly.

Contact:
Michelle May
Safety Program Manager
Ohio DOT
614-644-8309
Michelle.May@dot.state.oh.us

Funding Goals for Proactive Improvements

Original publication: HSIP Noteworthy Practice Series, HSIP Project Identification; FHWA-SA-11-02(PDF, 2.7MB)


The data analysis conducted for the development of Minnesota’s original Strategic Highway Safety Plan (SHSP) in 2004 indicated a large percentage of severe crashes were occurring on local roadways. All Highway Safety Improvement Program (HSIP) funding was managed by eight Area Transportation Partnerships (ATP)1, and a small portion of the funding was allocated to local road safety improvements. To ensure the state was using HSIP funding in the best way possible, Minnesota restructured the program to provide funding for local agencies in Greater Minnesota (areas not within the Minneapolis-St. Paul metro area) and developed funding goals for proactive and reactive improvements.

Minnesota distributes HSIP funding to each district based on the proportion of fatal and serious injury crashes occurring in the district. The district funds are then allocated to local roads and state highways based on the proportion of fatal and serious injury crashes occurring on the corresponding roadways. The split ranges from 28 percent to state highways and 72 percent to local roadways in the Metropolitan District, to a 50/50 split in District 1 (average across districts is 35 percent to state highways and 65 percent to local roadways).

In Minnesota approximately 70 percent of all crashes occur in urban areas; however, approximately 70 percent of the fatal crashes occur in rural areas. To address the inherent differences in the safety issues of urban and rural areas, Minnesota has established two separate goals to guide safety investments:

  • Metropolitan District (Minneapolis/St. Paul area): at least 30 percent of the safety funds go towards proactive low-cost safety improvements, and
  • Greater Minnesota (8 Rural Districts): at least 70 percent of the safety funds go towards the proactive deployment of low-cost strategies.

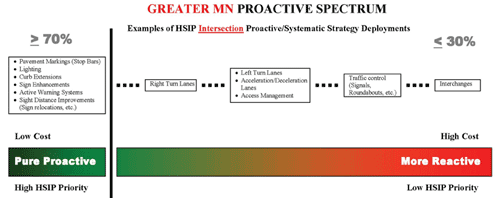
Minnesota developed a “proactive spectrum” decision support tool for use in project selection, which has been in use since 2007. The spectrum ranges from proactive low-cost projects (e.g. pavement markings, rumble strips, lighting, sign enhancements, etc.) to reactive/high-cost improvements (e.g., interchanges, roadway realignments, etc.). The proactive improvements are focused on improving the safety of the system overall, rather than focusing on a high crash location.

"Graphic showing Greater Minnesota's Proactive Spectrum: Examples of HSIP Intersection Proactive/Systematic Strategy Deployments: from low cost, purely proactive projects receiving high HSIP priority, to high cost, more reactive projects receiving low HSIP priority"

Projects are selected for funding through a competitive selection process. Proactive projects are prioritized using a point system based on factors such as whether the project meets the intent of the SHSP, fatal and serious injury crashes per mile, cost per mile or per intersection, and traffic levels. Additional points are awarded if the location was identified in the High Risk Rural Roads Program or the Five Percent report. Reactive projects are prioritized based on the project’s benefit-cost ratio and other factors. The objective of this process is to prioritize and fund safety projects with the greatest impact on reducing fatal and serious injury crashes.

Key Accomplishments

  • Implemented proactive approach to the HSIP project selection process.
  • Shifted funding to local jurisdictions.

Results

Minnesota has successfully shifted the focus of its HSIP to a proactive approach through the development of the “Proactive Spectrum.” This enables the state to focus on projects with the greatest potential impact on safety.

The proportion of funding spent on proactive improvements has been increasing over the last few years. Of the projects programmed for fiscal year 2010-2011, almost 90 percent were proactive. Since 2007, Minnesota has funded safety projects on local and state roads to implement over: 6,714 miles of 6-inch wide edge lines; 80 miles of edge line rumble strips; 594 miles of edge line rumble stripes; 236 rural intersections with street lighting; 1,347 curves with chevron signing; and 230 miles of cable median barrier.

Contact

Julie Whitcher
Minnesota Department of Transportation
651-234-7019
julie.whitcher@state.mn.us

Centralized HSIP Funding and Evaluation Results in Safety Projects Aligned with SHSP

Original publication: SHSP Implementation Process Model, Supplement Number 1 – Case Studies; FHWA-SA-10-025; 2010(PDF, 1MB)


Key Accomplishments

  • Established district-level safety teams to identify hazardous locations and develop projects aligned with the SHSP.
  • Developed objective criteria for project identification and prioritization resulting in increased alignment with the SHSP.
  • Provided support for safety studies by local governments and MPOs providing more opportunities for local agencies to propose safety projects.

To continue to reduce highway fatalities and serious injuries the Ohio Department of Transportation (ODOT) recognized the need to ensure safety projects were being developed at the local level. It was critical that projects be evaluated based on criteria designed to ensure that locations with the greatest safety needs were being addressed throughout the State. ODOT also wanted to provide more opportunity for local agencies to propose safety projects.

To achieve these goals, ODOT centralized Highway Safety Improvement Program (HSIP) funding and developed a management process that includes district safety review teams (DSRT). In each ODOT district, a safety review team was formed, including ODOT representatives from planning, production, highway management, and traffic engineering, as well as representatives from law enforcement agencies and local metropolitan planning organizations (MPO). Representatives from the Ohio Traffic Safety Office and the FHWA were also invited to participate. Many members of DSRTs were actively involved in the SHSP process, which encouraged the alignment of district safety activities with State priorities. Each DSRT develops and adopts annual work plans, reviews safety studies, and recommends countermeasures.

To identify high-risk locations and countermeasures, each DSRT reviews an ODOT-provided list of intersections and highway segments with high-crash frequencies. Districts are required to perform safety studies to determine contributing crash factors and to develop plans to implement safety improvements. As part of this effort information on high-risk locations also is provided to local jurisdictions. Project sponsors are encouraged to examine a full range of mitigation options, including those that are short-term and low-cost (e.g., new signs, pavement markings, and drainage improvements), as well as those that are mid-term and mid-cost (e.g., new traffic signals, turn lanes, and realignments).

District offices may pay for these improvements through their annual district budgets or they may apply for HSIP funding. The DSRTs submit project applications for funding consideration on behalf of local agencies. Local governments and MPOs can also propose projects with support from the DSRT and receive assistance with safety studies.

A six-member committee at ODOT headquarters reviews applications for projects generated via the DSRT process. Projects are evaluated and prioritized based on uniform and objective criteria that align with the SHSP. Selection criteria include:

  • Crash frequency/density;
  • Crash rate;
  • Severity Index (represents the relative cost to society of a specific type of crash);
  • Equivalent property-damage-only rate;
  • Percent commercial motor vehicle-related;
  • Rate of return; and
  • High-risk rural roads.

The committee may approve a project proposal, select a different safety strategy, or request further study before allocating funding.

Results

The centralized HSIP funding process has resulted in the development of safety projects closely aligned with the SHSP. The process is generating increased safety project proposals by local agencies and MPOs.

Contact:
Michelle May
Safety Program Manager
Ohio DOT
614-644-8309
Michelle.May@dot.state.oh.us

State Safety Charter

Original publication: SHSP Implementation Process Model, Supplement Number 1 – Case Studies; FHWA-SA-10-025(PDF, 1MB)


Key Accomplishments

  • Developed a formal agreement among stakeholder agencies to support SHSP.
  • Publicly declared a fatality reduction goal to focus stakeholder agency efforts.
  • Added flexibility to the agreement to allow the SHSP goals to change as new data become available.

In 2005, to strengthen the commitment to safety, the Ohio Department of Transportation (ODOT) and SHSP steering committee were given authority by the Governor and key agency Directors to make decisions regarding the safety planning process. To formally document Ohio’s commitment to safety and the collaborative process, lead agency Directors signed a MOU, known as the “Safety Charter.” The charter will be updated as trends change. The charter identifies eight overarching strategies defining the agencies’ shared mission and Ohio safety priorities:

  • Crash data improvements;
  • Use of a multidisciplinary approach;
  • Coordination of resources at all levels of government;
  • Coordination across jurisdictional boundaries;
  • Pursuit of innovative technologies;
  • Education of road system users;
  • Involvement by nontraditional partners; and
  • On-going evaluation.

The charter also commits Ohio to reduce the fatality rate to no more than 1.0 per 100 million vehicle miles of travel or 1,100 fatalities per year by the end of 2008. In 2010 the Charter will be updated to include county engineers and other local government representatives.

The charter was signed by the leadership of ODOT, the Ohio Rail Development Commission, the Public Utilities Commission of Ohio, the Ohio Department of Public Safety (DPS), State Highway Patrol, FHWA, FMCSA, NHTSA, and FRA. Signatories pledged the necessary resources to address the principles outlined.

Results

All partner agencies committed in writing to contribute resources and support the SHSP goals. The charter formally empowers ODOT and SHSP leadership to manage and implement the SHSP.

Contact:
Michelle May
Safety Program Manager
Ohio DOT
614-644-8309
Michelle.May@dot.state.oh.us

SHSP Implementation Chart

Original publication: SHSP Implementation Process Model, Supplement Number 1 – Case Studies; FHWA-SA-10-025; 2010(PDF, 1MB)


Key Accomplishments

  • Successfully tracked SHSP implementation progress across multiple agencies.
  • Facilitated ownership of strategy implementation efforts by lead agencies.

One of the most challenging aspects of SHSP implementation is tracking the responsibilities and activities undertaken by multiple partners to address different emphasis areas. To comprehensively manage this process, Ohio developed “Implementation Charts,” which are easy-to-use templates for documenting the strategies, action steps, and implementation responsibilities within each SHSP emphasis area. Each action step includes a brief description, relative performance indicators, the agency or agencies responsible for implementation, relative cost, timeline, and whether this is a new or existing program. Relative cost is qualitatively classified as low (less than $100,000), moderate ($100,000 to $500,000), moderate to high ($500,000 to $2 million), or high (more than $2 million). The timeline is classified as short (less than one year), medium (one to two years), or long (more than two years). The charts also document the status of activities as individual action steps are undertaken. The Implementation Charts are in an easy-to-read format and provide the fundamental information necessary for tracking SHSP implementation.

Results

By using the Implementation Charts, partners are better able to track the status of action items and ensure tasks are completed on time. Additionally, action step responsibilities are clearly defined, communicated, and reported so each agency takes ownership for specific aspects of SHSP implementation.

Contact:
Michelle May
Safety Program Manager
Ohio DOT
614-644-8309
Michelle.May@dot.state.oh.us

Enforcement and Engineering Collaboration

Original publication: SHSP Implementation Process Model, Supplement Number 1 – Case Studies; FHWA-SA-10-025; 2010(PDF, 1MB)


Key Accomplishments

  • Developed structure for enhanced collaboration on commercial vehicle issues.
  • Increased discussion of truck safety issues to support the SHSP.
  • Installed new infrastructure to increase truck regulatory enforcement.

The Michigan Department of Transportation (MDOT) engineering staff and the State Police developed a commercial vehicle strategy team comprised of six individuals from each agency for enhanced communication and collaboration.

The catalyst for formation of the team was a professionally facilitated three-day meeting during which participants discussed organizational and operational challenges and the need for a new approach. During this initial meeting, the concept of the Commercial Vehicle Strategy Team was generated, and the group developed a mission statement, goals, and defined a quarterly meeting structure.

On an ongoing basis, the team collaborates on truck size and weight and safety issues with a subcommittee dedicated to each. The subcommittees make recommendations to the Committee at large on improvements.

Results

As a result of input from the Strategy Team, MDOT has installed 15 new weigh stations and maintained and enhanced other stations previously targeted for closure. The State has installed wireless weigh-in-motion technology at 21 locations, and repairs and enhancements are being made to existing sites. MDOT has installed safe enforcement sites (pull-out stations) where trucks can be safely pulled over for size and weight inspections.

Contact:
Captain Robert Powers
Traffic Safety Division
Michigan State Police
517-336-6447
powersr@michigan.gov

Making Complete Streets in Portland, CT

2021 Road Safety Award


Located in central Connecticut and responsible for 63 miles of roadway, the Town of Portland is a small community of under 10,000 residents that faced serious safety concerns regarding vehicle speeds and limited opportunities for safe walking and cycling. To address these concerns, a grassroots Complete Streets Group (CSG) wrote the Complete Streets Policy and got the Town’s elected leaders to formally adopt it in 2016. The CSG then started working with Public Works and the Town Engineer to plan, design, and construct safety improvements.

Read more