USA Banner

Official US Government Icon

Official websites use .gov
A .gov website belongs to an official government organization in the United States.

Secure Site Icon

Secure .gov websites use HTTPS
A lock ( ) or https:// means you’ve safely connected to the .gov website. Share sensitive information only on official, secure websites.

U.S. Department of Transportation U.S. Department of Transportation Icon United States Department of Transportation United States Department of Transportation

Noteworthy Practices

Left Nav - HSA Learn Safety

Ohio DOT Implements New Roadway Safety Management Process with AASHTOWare SafetyAnalyst™

Original publication: Highway Safety Manual Case Study 2: Implementing a New Roadway Safety Management Process with AASHTOWare Safety Analyst™ in Ohio


ODOT's use of AASHTOWare Safety Analyst™ (SA) allowed it to develop multiple screening methods in the network screening process resulting in greater identification of rural corridors and projects.

Issue

Application of the Highway Safety Manual (HSM) and related safety data tools.

Key Accomplishments

“Ohio DOT is excited about the opportunities that SA provides the highway safety engineering community by allowing the end users to easily perform network screenings and countermeasure evaluations with a high level of statistical rigor.”

– Jonathan Hughes, ODOT

  • Establishing a process that advances the capacity to perform roadway safety analysis while also shortening the time needed to conduct the analysis.
  • Improving data collection and data quality.
  • Working with IT staff (a crucial step) to ensure hardware and software needs were met in all offices.

Results

Applying various HSM screening methods identified ways to overcome some of the limitations of existing practices. For example, the agency's previous mainframe methodology typically over-emphasized urban “sites of promise,” or those locations identified for further investigation and potential countermeasure implementation.

Benefits

  • The extensive data gathering effort increased output reliability, allowing the agency to direct safety funds to locations where transportation improvements have the greatest potential to reduce severe (fatal and injury) crashes.
  • A big advantage of AASHTOWare Safety Analyst™—in comparison to the previous mainframe process—is the ability to quickly apply the more sophisticated screening methods within the HSM.
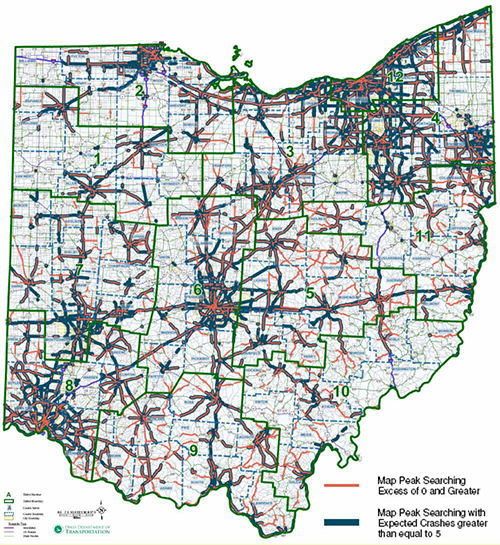
"map of Ohio with highway segments colored to show expected and excess crashes"
Figure 1: GIS Display of Expected and Excess Crashes for Highway Segments


Contact

Jonathan Hughes, P.E.
Ohio Department of Transportation
(614) 466-4019
Jonathan.Hughes@dot.state.oh.us
Idaho Uses Predictive Methods in IHSDM to Evaluate Safety in Idaho 8 Corridor

Original publication: Highway Safety Manual Case Study 1: Using Predictive Methods for a Corridor Study in Idaho


Idaho used FHWA's Interactive Highway Safety Design Model (IHSDM) along the Idaho 8 corridor to evaluate existing traffic, roadway geometry, and predict crashes using these and the corridor's recent crash history.

Issue

Application of the Highway Safety Manual (HSM) and related safety data tools.

Key Accomplishments

“The advantage of employing IHSDM on this project was the opportunity to perform a detailed and simultaneous review within the corridor on a variety of critical elements (that is, traffic operations, geometry, safety) to isolate potential problem areas and allow development of strategic mitigation strategies.”

– Bob Beckman, Project Manager

  • FHWA's Interactive Highway Safety Design Model was used to evaluate the safety and operational effects of existing traffic and roadway geometry on highways. This evaluation, along with the corridor's recent crash history, was used to predict crashes.
  • While the IHSDM is a data intensive program, the time and effort invested in data entry is rewarded through the production of a detailed quantitative safety analysis.

Results

The development of a more advanced safety analysis for the Corridor Study that was data-driven and integrated into the Statewide Transportation Improvement Program (STIP).

Benefits

  • The IHSDM Policy Review and Crash Prediction modules were very useful in identifying existing geometric deficiencies, specific locations needing further evaluation, locations needing possible design improvements, and potential safety issues in the corridor.
  • A Corridor Plan Report was prepared to document the review, analysis, and resulting recommendations of this study to be included in the STIP for future implementation.

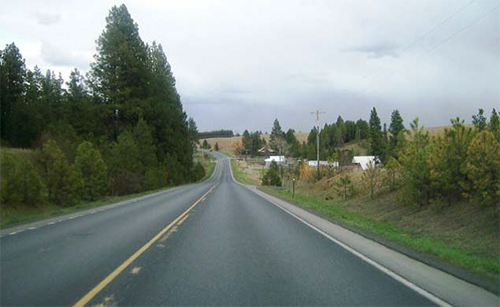
"Photograph of a section of Idaho's Highway 8"

Figure 1: Idaho 8 Corridor

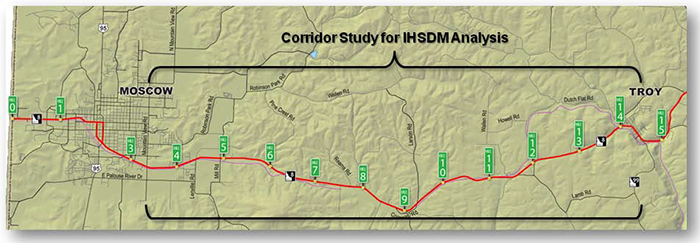
"map showing the area of Highway 8 in the Corridor study"

Figure 2: Idaho 8 Corridor Map

Contact

Ken Helm Senior Transportation Planner
Idaho Transportation Department
(208) 799-4229
ken.helm@itd.idaho.gov

Maryland Evaluates the Safety Benefits of Modern Roundabout Intersections Compared to Two-way Stop-controlled Intersections

Original publication: Roundabouts – The Maryland Experience: a Maryland Success Story (FHWA-SA-09-018)(PDF, 548kB)


The National Highway Traffic Safety Administration (NHTSA) data show that approximately 733,000 people were injured and 7,196 were killed in intersection-related traffic crashes in 2008. The Maryland State Highway Administration (MDSHA) was concerned about the high number of crashes at some of its intersections controlled by two-way stop signs.

Recognizing that high approach speeds coupled with drivers violating stop-controls can result in crashes, MDSHA converted five rural, two-way stop-controlled intersections experiencing a high incidence of crashes, many with injuries, to single-lane roundabout intersections.

"Photograph of a warning sign showing counterclockwise rotating arrows that indicate a roundabout is ahead"
Figure 1:   Roundabout warning sign
Source: Maryland State Highway Administration (used with permission)


"Diagram showing the eight potential vehicle conflict points on a standard two-lane roundabout"
Figure 2:   Eight vehicle conflict points
Source: FHWA Roundabouts: An Informational Guide


""Diagram showing the 32 potential vehicle conflict points on a standard two-lane roundabout
Figure 3:   32 vehicle conflict points
Source: FHWA Roundabouts: An Informational Guide


Key Accomplishments

As the Maryland experience demonstrates, roundabouts can effectively improve safety and reduce traffic crashes and their resulting injuries and/or fatalities.

Results

The roundabouts installed at these Maryland stop-controlled intersections cumulatively reduced total crashes by approximately 69.1 percent and injury crashes by 88 percent in a three-year period after the roundabouts were installed. During this same period, the fatal crashes were eliminated, falling from three under the stop-controlled intersection design to zero after the roundabouts were installed.

Contact

Mike Niederhauser
Maryland State Highway Administration
tmniederhauser@sha.state.md.us

Street Lights at Urban and Rural Intersections Reduce Late-Night/Early Morning Intersection Crashes in Minnesota

Original publication: Reducing Late-Night/Early Morning Intersection Crashes by Providing Lighting (FHWA-SA-09-017)(PDF, 467kB)


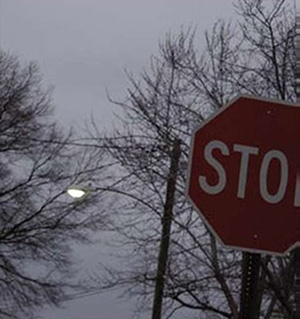
More than 40 percent of intersection fatalities occur during late-night/early-morning hours. Further, the crash fatality rate during the late-night/early-morning hours is as much as three times greater than during the day (Traffic Safety Facts, National Highway Traffic Safety Administration, 2008). Minnesota and Kentucky were concerned about the high number of crashes at some of their intersections during late-night/early-morning hours.

Recognizing that poor visibility at intersections during late-night/early-morning hours can cause crashes, the States of Minnesota and Kentucky installed lighting at 55 intersections experiencing a high incidence of crashes.

"Photograph of a stop sign illuminated by a street light"
Figure 1:   Evening view of stop sign at intersection
Source: Photo by April Armstrong (used with permission)


Key Accomplishments

As the states' experience demonstrates, providing lighting can effectively improve safety and reduce traffic crashes and their resulting injuries and/or fatalities during late-night/early-morning hours.

Results

The enhanced countermeasure reduced overall late-night/early-morning crashes across these intersections by a weighted average of 35 percent.

Contact

Susan Zarling
Office of Traffic Safety
Minnesota Department of Transportation
susan.zarling@state.mn.us

Colorado Implements Continuous Green T-Intersections to Reduce the Number of Angle Crashes

Original publication: Continuous Green T-Intersections (FHWA-SA-09-016)(PDF, 634kB)


Angle crashes are among the most severe crashes that occur at intersections, including “T- intersections,” across the United States. Research has shown that a primary reason for the high number of crashes is driver inability to judge gaps in opposing traffic. The Colorado Department of Transportation (CDOT) was concerned about the high number of crashes at some of its rural T-intersections controlled by traffic signals.

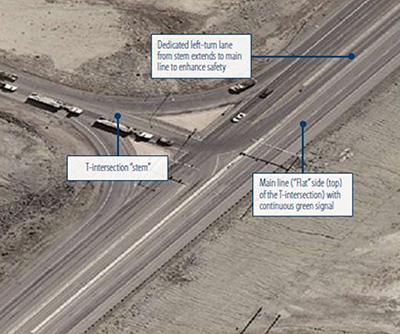
Recognizing that inadequate stopping sight distance can cause crashes, CDOT installed continuous green T-intersection (CGT) at two intersections experiencing a high incidence of crashes, many with injuries. (These existing intersections met minimum Manual on Uniform Traffic Control Devices standards). The CGT design allows main line through traffic to pass through a signalized intersection without stopping while eliminating conflicting left-turning vehicular movement.

"Photograph of a T-intersection where the signal-controlled through tlane at the top of a T-instersection was converted to a continuous green T. Labels indentify the stem of the T and note the addition of a dedicated left turn lane for trafffic seeking to turn left from the stem of the T onto the flat (top) of the T."
Figure 1:   Aerial view of the CGT in Grand Junction, Colorado
Source: Photo from Zane Znamenacek, CDOT (used with permission)


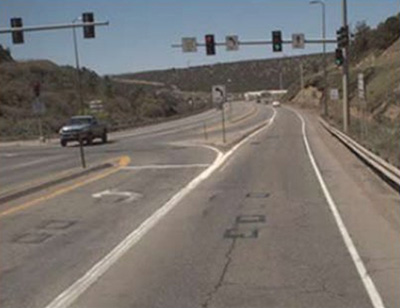
"Photograph of an intersection that was converted to a continuous green T. Photo is taken from the flat of the T on the approach to the intersection, with the stem to the left. The intersection features a dedicated lane for vehicles turning from the stem onto the flat of the T."
Figure 2:   Westbound on US-160
Photo from David Pickren, CDOT (used with permission).


Key Accomplishments

As the CDOT experience demonstrates, CGTs can effectively improve safety and reduce traffic crashes (particularly angle crashes) and their resulting injuries and/or fatalities.

Results

The safety enhancements installed at these Colorado signalized intersections cumulatively reduced total crashes by 60 percent, injury crashes by 70 percent, and angle crashes by 96.8 percent per year.

Contact

Zane Znamenacek
Region 3 Traffic Operations Engineer
Colorado Department of Transportation
Zane.Znamenacek@dot.state.co.us

Permissive/Protected Left Turn Phasing in Detroit and Grand Rapids

Original publication: Permissive/Protected Left Turn Phasing (FHWA-SA-09-015)(PDF, 441kB)


Left-turning movements are generally acknowledged to be the highest-risk movements at intersections. An estimated 27 percent of all intersection-related crashes in the United States are associated with left turns, with over two-thirds of these crashes occurring at signalized intersections (O'Connor, T., “Intersection Collision Avoidance Systems Web Page,” California Center for Innovative Transportation, August 2004). The cities of Detroit and Grand Rapids, Michigan, were concerned about the high number of crashes at some of their signalized intersections.

The cities modified the permissive left-turn mode to a permissive/protected mode at 3 intersections experiencing a high incidence of crashes, many with injuries and many due to left-turn head-on crashes.

"Two side-by-side photos of permissive-protected signal heads, with the photo on the left showing the permissive phase (circular green) and the photo on the right showing the protected phase (left-turn arrow)."
Figure 1:   Permissive/Protected Mode
Photo courtesy of Michigan Department of Transportation (used with permission).


Key Accomplishments

As the Michigan experience demonstrates, low-cost improvements can effectively improve safety and reduce traffic crashes and their resulting injuries.

Results

The enhanced countermeasure installed at these signalized intersections cumulatively reduced total crashes by approximately 32 percent, injury crashes by 58.9 percent, and left-turn head-on crashes by an average of 84 percent per year.

Contact

Tapan Datta
WSU-Transportation Research Group, MI
tdatta@eng.wayne.edu

Cities of Detroit and Highland Park, MI Implement Low-cost Strategies That Measurably Improved Safety

Original publication: Improving Safety by Providing All-Red Clearance Intervals and Larger Signal Lenses (FHWA-SA-09-014)(PDF, 563kB)


Red-light running is estimated to cause more 170,000 injuries and approximately 900 deaths per year (FHWA, Red-Light Running Web Site). Some of these crashes occur because of driver speeding, distracted driving, or inability or failure to see the traffic control device in time to comply. The cities of Detroit and Highland Park, Michigan, were concerned about the high number of crashes, particularly angle crashes, at some of their signalized urban intersections.

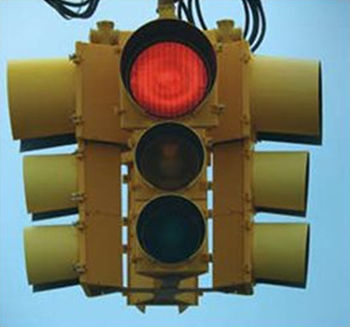
The cities of Detroit and Highland Park implemented all-red clearance intervals and larger signal lenses at 33 intersections experiencing a high incidence of crashes (particularly angle crashes), many with injuries.

""Photograph of a 4-way signal head in which the red light lens is 12 inches in diameter and the yellow and green lenses below it are 8 inches in diameter.
Figure 1: Relative size difference between 12-inch (top lens) and 8-inch signal lens (bottom lenses)


"Map of the Woodward Avenue Corridor"
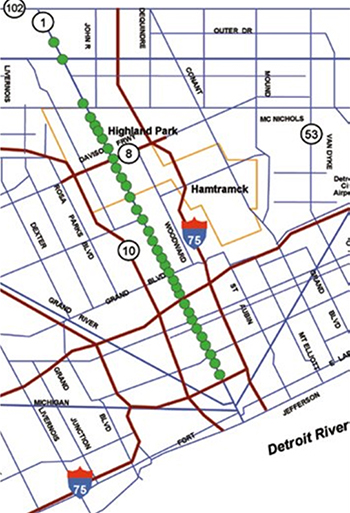
Figure 2:   Site Map of the Woodward Avenue Corridor


Key Accomplishments

As the Michigan experience demonstrates, low-cost improvements can effectively improve safety and reduce traffic crashes and their resulting injuries.

Results

The combinations of enhanced countermeasures installed at these Michigan signalized intersections cumulatively reduced total crashes by approximately 33.3 percent and injury crashes by an average of 45.5 percent per year. Angle crashes were reduced by a significant 75.7 percent per year at the treated intersections.

Contact

Tapan Datta
WSU-Transportation Research Group, MI
tdatta@eng.wayne.edu

Minnesota Roundabout - A Scott County Success Story

Original publication: Minnesota Roundabout - A Scott County Success Story (FHWA-SA-09-013)(PDF, 587kB)


Two fatal crashes and 50 injury crashes occurred in a five-year period at the rural, two-way stop, high-speed intersection of Highway 13 and County Road 2 in Minnesota. Attempts to reduce crash frequency with a variety of safety treatments at the intersection (including larger stop signs, striping, and flashing lights) were relatively unsuccessful.

The Minnesota Department of Transportation (Mn/DOT) sought to reduce crashes by converting the two-way stop controlled intersection to a single-lane roundabout. The roundabout was constructed with a central island 110 feet in diameter.

""Photo of the roundabout installed at the intersection of Highway 13 and County Rd 2 in Scott County, MN
Figure 1:   Intersection of State Highway 13 and County Road 2
Photo by Jody K. Hassel (used with permission)


"Diagram showing the eight potential vehicle conflict points on a standard two-lane roundabout"
Figure 2:   Eight vehicle conflict points
Source: FHWA Roundabouts: An Informational Guide


""Diagram showing the 32 potential vehicle conflict points on a standard two-lane roundabout
Figure 3:   32 vehicle conflict points
Source: FHWA Roundabouts: An Informational Guide


Key Accomplishments

The Minnesota Department of Transportation (Mn/DOT) sought to reduce crashes by converting the two-way stop controlled intersection to a single-lane roundabout. The roundabout was constructed with a central island 110 feet in diameter.

Results

Converting this intersection to a roundabout resulted in a 76.2 percent reduction in total crashes and a 78.7 percent reduction in injury crashes. Angle crashes were eliminated.

Contact

Anthony Winiecki
Scott County Public Works Department
Jordan, MN
336-747-6867
twiniecki@co.scott.mn.us

Signal Flashing Mode Removed During Late-Night/Early-Morning Operation

Original publication: Removal of Signal Flashing Mode during Late-Night/Early-Morning Operation; FHWA-SA-09-012; 2009 (PDF, 379kB)


For years, it has been standard practice to operate traffic signals in the flashing mode when traffic volumes are low, typically during late-night/early-morning hours. Recognizing that field studies have indicated that crash rates may increase around traffic signals using flashing operations during late-night/early-morning conditions (Source: S.F. Polanis, “Right-Angle Crashes and Late-Night/Early-Morning Flashing Operation: 19 Case Studies,” ITE Journal, April 2002). The City of Winston-Salem, North Carolina was concerned about the high number of crashes at urban signalized intersections operating in the flashing mode during late-night/early-morning hours.

The City of Winston-Salem changed signal operations from flashing mode to steady (stop-and-go) mode during late-night/early-morning hours at 8 intersections experiencing a high incidence of injury crashes, particularly right-angle crashes. The eight intersections ranged in size from one-to-three lanes in each direction, with most being two-lane intersections. All of the intersections had a speed limit of 35 mph (with one 30 mph cross street).

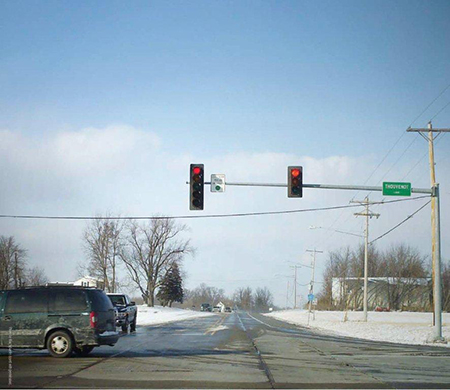
"Early morning photograph of a rural road with non-flashing traffic lights"
Figure 1   Photo by Ron Schaefer (used with permission)


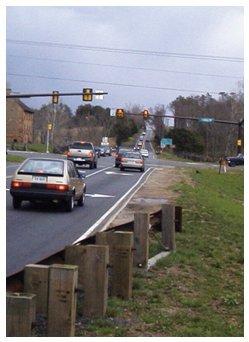
"Early morning photograph of a two-lane suburban road with non-flashing traffic lights"
Figure 2   Photo by Vaughn W. Inman (used with permission)


Key Accomplishments

As the Winston-Salem experience demonstrates, removing signals from late-night/early-morning flashing mode operation effectively improves safety and reduces traffic crashes and their resulting injuries.

Results

The removal of the late-night/early-morning flashing mode from eight urban intersections in Winston-Salem cumulatively reduced total crashes by 30.9 percent, injury crashes by 60.1 percent, and right-angle crashes by 88.8 percent per year.

Contact

Stanley Polanis
Director of Transportation
City of Winston-Salem, NC
336-747-6867
stanp@cityofws.org

Retroreflective Borders on Traffic Signal Backplates

Original publication: Retroreflective Borders on Traffic Signal Backplates – A South Carolina Success Story; FHWA-SA-09-011; 2009(PDF, 377kB)


Red-light running is estimated to cause more than 200,000 crashes, 170,000 injuries, and approximately 900 deaths per year (Source: Federal Highway Administration, Red-Light Running Web Site (2008)). One of the reasons for the high number of crashes is driver inability or failure to see the traffic control device in time to comply. The South Carolina DOT (SCDOT) was concerned about the high number of crashes at some of its urban signalized intersections. It recognized that poor signal visibility can cause crashes. In response, SCDOT installed retroreflective borders on existing signal backplates at three intersections in the Columbia area that were experiencing a high incidence of crashes, many with injuries.

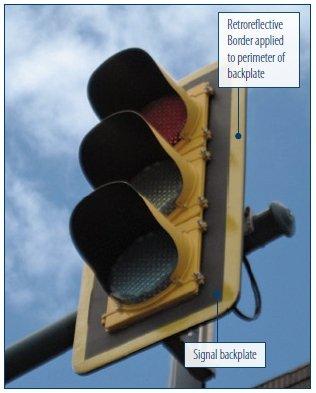
"Closeup photograph of a retroreflective traffic light, showing the signal backplate and the retroreflective border applied to the perimeter of the backplate"
Figure 1   Photo courtesy of KLS (used with permission)


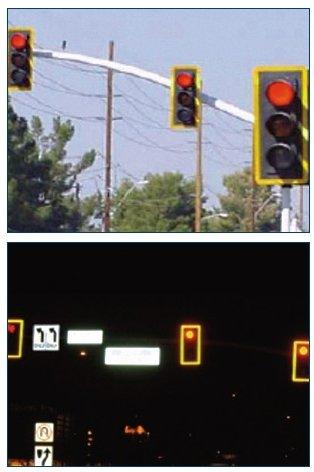
"Photograph of a set of three retroreflective traffic lights across a pole during daylight and another photograph of a different set of three in darkness"
Figure 2   Photos courtesy of South Carolina Department of Transportation (used with permission)


Key Accomplishments

The SCDOT experience demonstrates that low-cost improvements can effectively improve safety and reduce traffic crashes and their resulting injuries.

Results

The retroreflective borders installed at these Columbia signalized intersections cumulatively reduced total crashes by approximately 28.6 percent, injury crashes by 36.7 percent, and late-night/early morning crashes by 49.6 percent per year.

Contact

Joey D. Riddle
SCDOT
RiddleJD@dot.state.sc.us