USA Banner

Official US Government Icon

Official websites use .gov
A .gov website belongs to an official government organization in the United States.

Secure Site Icon

Secure .gov websites use HTTPS
A lock ( ) or https:// means you’ve safely connected to the .gov website. Share sensitive information only on official, secure websites.

U.S. Department of Transportation U.S. Department of Transportation Icon United States Department of Transportation United States Department of Transportation

Noteworthy Practices

Left Nav - HSA Learn Safety

Enhanced Signs and Markings at Stop Sign-Controlled Intersections

Original publication: Stop Sign-Controlled Intersections: Enhanced Signs and Markings: A Winston-Salem Success Story; FHWA-SA-09-010; 2009 (PDF, 355kB)


Stop signs are the primary form of traffic control at intersections across the United States. However, intersections controlled by stop signs account for one-third of all intersection crashes and more than 40 percent of fatal crashes (Source: Insurance Institute for Highway Safety, Volume 37, No 9, October 26, 2000). The City of Winston-Salem, North Carolina, was concerned about the high number of crashes at some of its intersections controlled by stop signs. It recognized that poor sign visibility and inadequate markings can cause crashes.

The city of Winston-Salem installed additional and larger stop signs, “Stop Ahead” advance traffic control signs, and clearly visible centerline markings and stop bars in various combinations at 16 intersections experiencing a high incidence of crashes, many with injuries.

Key Accomplishments

The Winston-Salem experience demonstrates that low-cost improvements can effectively improve safety and reduce traffic crashes and their resulting injuries and/or fatalities.

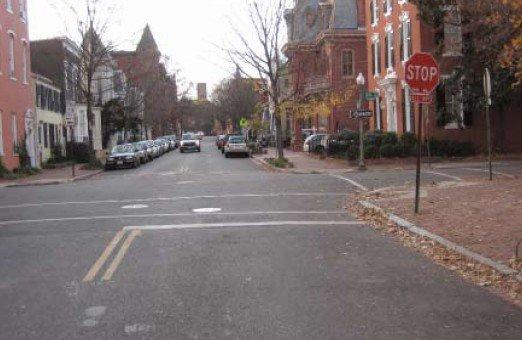
"Photograph of a stop sign-controlled intersection after enhancements in Winston-Salem, NC"
Figure 1   Double-yellow centerline and stop bars added to existing (24-inch) stop sign.


Results

The combinations of these enhanced countermeasures installed at the 16 Winston-Salem stop-controlled intersections cumulatively reduced total crashes by approximately 55 percent and total injuries by an average of 70 percent per year.

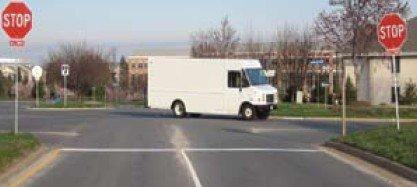
"Photograph of a second stop sign-controlled intersection after enhancements in Winston-Salem, NC"
Photograph of a second stop sign-controlled intersection after enhancements in Winston-Salem, NC


Contact

Stanley Polanis
Director of Transportation
City of Winston-Salem, NC
336-747-6867
stanp@cityofws.org

Safety Evaluation Group

Original publication: HSIP Noteworthy Practice Series, HSIP Project Evaluation; FHWA-SA-11-02; 2011(PDF, 2.3MB)


In 1999, the North Carolina Department of Transportation (NCDOT) created a permanent group of employees to focus on safety project evaluation. The purpose for the group was to establish a formal project evaluation process to verify the success of the state’s efforts in safety.

In the first four years following its formation, the group established a process for conducting project evaluation and identified what results would be most useful to the field engineers. The group’s initial efforts were more research and technically oriented but, to better serve the needs of the field engineers, the results of the evaluation studies were simplified (the field engineers were most interested in the before and after crash diagrams and changes in crash patterns). Originally, the group conducted about 50 project evaluations a year with one supervisor and six engineers, but now the group completes approximately 200 evaluations a year with reduced staff (one supervisor, four engineers, and one technician).

The safety evaluation group conducts simple before-after studies on all spot safety projects once a minimum of three years of before and after data are available (the same time periods are used for both the before and after periods). For each project, the group prepares an evaluation report including before and after crash type and severity data, collision diagrams, photos, and discussion of the study results. After an evaluation report is completed, it is submitted to the field engineer who originally developed the project to provide feedback on whether the project successfully mitigated the previously identified safety issue. For projects unsuccessfully mitigating the safety issue or resulting in a different crash pattern, the evaluation report provides the field engineer with an opportunity to reassess the conditions and identify a different countermeasure. NCDOT is currently working on developing a process to track projects not successfully mitigating the safety issue they were intended to address.

The evaluation group compiles a spreadsheet of all the completed project evaluation studies. The spreadsheet provides the category of improvement, before and after traffic volumes, location, traffic control, geometry, etc., and provides a link to the detailed evaluation report. The spreadsheet is updated regularly and posted on the NCDOT web site. It can be used by engineers to determine which treatments have worked in the past.

The group also develops crash modification factors (CMF) using the Empirical Bayes (EB) method when enough sample sites and data are available. North Carolina specifically focuses on developing CMFs for countermeasures not already extensively researched.

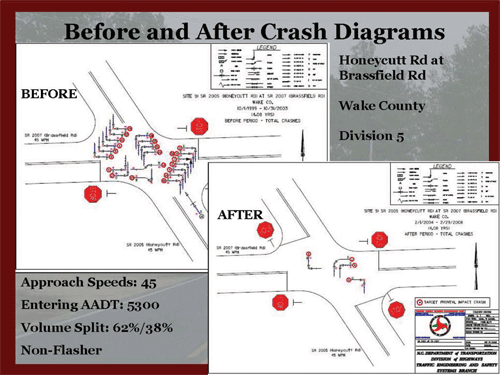
""Graphic of Before and After Crash Diagrams that shows vehicles' motion and crash data: intersection street names, county name, division number, approach speeds, volume split, and traffic signal type

In efforts to promote a particular countermeasure to the field engineers, NCDOT’s evaluation group has also conducted studies on well documented countermeasures to provide evidence of crash reduction effectiveness. One example is the use of four-way stop control. Although several studies document the effectiveness of this countermeasure, many field engineers in North Carolina did not consider it a viable countermeasure. The group evaluated over 50 intersections throughout the State and demonstrated four-way stop controls were effective. Study results were presented to field engineers in an effort to change their perspective. While field engineers were very receptive to the study results, it is too early to determine if it has increased the use of four-way stop control in the State.

Key Accomplishments

  • Established a group focused on safety project evaluation.
  • Promoted the use of effective countermeasures.
  • Provided feedback to engineers on the effectiveness of their individual safety projects and various countermeasures.

Results

Since the establishment of the safety evaluation group, North Carolina has evaluated and documented the results of more than 600 projects. The evaluation reports provide field engineers with valuable feedback on the effectiveness of their safety projects, as well as various countermeasures, and promote the use of effective countermeasures.

Contact

Shawn Troy
North Carolina Department of Transportation
919-773-2897
stroy@ncdot.gov

SHSP/HSIP Alignment

Original publication: SHSP Implementation Process Model, Supplement Number 1 – Case Studies; FHWA-SA-10-025; 2010(PDF, 1MB)


Key Accomplishments

  • Established a strong safety focus in regional DOT offices emphasizing the SHSP.
  • Provided improved guidance on safety project development to local agencies resulting in improved project quality and focus on the most serious hazardous locations.
  • Implemented multiple pedestrian safety projects including countdown pedestrian signals, dynamic speed signs in school areas, pedestrian freeway overpasses, and grade separation of a bike path crossing.

Because the target fatal crash rate had not been achieved on the non-DOT portion of its road network, Michigan recognized that greater focus on local safety projects was needed. The Michigan Department of Transportation (MDOT) has a policy to distribute a cover letter to regional engineers and system managers strongly encouraging submission of safety projects in the annual call for projects. In addition, to provide more focus at the local level, the 2008 call for projects highlighted the need for local safety projects. As part of the process, MDOT delivered presentations on the SHSP at State conferences to increase awareness and alignment of safety projects with the emphasis areas.

In letters to the county road association and municipal league announcing the call for high-risk rural road and local safety projects, MDOT requires benefit/cost or time-to-return analysis on all project submissions for better alignment with the SHSP. To support local agencies in completing this requirement, MDOT provides a listing of accepted crash reduction factors for commonly submitted projects. The letters also promote submission of non-motorized projects, which aligns with the SHSP’s emphasis area on pedestrians and bicycles. To help with identification of high-risk locations, MDOT provides fatal and serious-injury crash maps by region on the Web site. Regional MDOT staff provides assistance to local agencies on project development when requested to make sure safety projects fit into a SHSP focus area.

Results

By providing local agencies more details on the types of safety projects MDOT seeks, the quality of submittals is improving and safety projects are aligning with SHSP emphasis areas.

Contact:
Jim D’Lamater
Safety Engineer
Michigan DOT
517-335-2224
dlamaterj@michigan.gov

Collaborative Problem Solving

Original publication: SHSP Implementation Process Model, Supplement Number 1 – Case Studies; FHWA-SA-10-025; 2010(PDF, 1MB)


Key Accomplishments

  • Built trust and understanding through inter/intraagency communication.
  • Improved data collection and analysis capabilities.
  • Considered safety in a wider range of transportation planning processes.

The process to develop and implement an effective SHSP requires a multidisciplinary approach from the state’s safety stakeholders. Working collaboratively to identify and solve the State’s transportation safety problems is central to the plan’s success.

States demonstrating success with implementation of their SHSPs find collaborative arrangements are the norm and tend to have superior inter/intraagency communication. Partners talk to one another on a frequent basis, building trust and understanding. This collaboration helps expand the SHSP’s reach to the broader safety community, and fosters the mindset that “we all understand what the safety priorities are.”

Collaboration results in wiser use of the State’s limited resources. States have found this approach helps improve their crash data collection and analysis capabilities. Solutions arrived at collaboratively among several agencies and data users result in improved processes and cost sharing. Collaboration on SHSP projects brings new partners to the effort and expands resources to assist with SHSP implementation.

One success story involves a close partnership between the Utah Department of Transportation (UDOT) and Utah Department of Public Safety’s Highway Safety Office (HSO). The HSO includes the UDOT Traffic and Safety Engineer in its annual NHTSA-required Highway Safety Plan process. This relationship is reciprocated by UDOT. UDOT includes the HSO as a partner to use HSIP flexible funds to implement behavioral programs. UDOT also provided a portion of STP Enhancement Funds to the SHSO for education and outreach programs involving pedestrian safety.

The benefits of the SHSP collaborative approach carry over to other projects as well. Personnel involved with the Motor Carrier Safety Assistance Program (MCSAP) are intimately involved in SHSP implementation. As a result, the MCSAP and the SHSP work in concert to address commercial vehicle traffic safety. This collaboration has led to the adoption of new technologies, such as speed detection signs, specifically addressing commercial vehicle safety.

Results

The State’s adoption of a collaborative problem solving approach resulted in improved data collection and analysis capabilities, new interagency collaborations on planning activities, and improved utilization of limited State resources.

Contact:
Robert Hull
Director, Traffic and Safety Division
Utah DOT
801-965-4273
rhull@utah.gov

Ohio Develops Centralized Data Source for All SHSP Partners

Original publication: SHSP Implementation Process Model, Supplement Number 1 – Case Studies; FHWA-SA-10-025; 2010(PDF, 1MB)


Key Accomplishments

  • Developed a centralized data source for all SHSP partners resulting in more consistent safety analysis Statewide.
  • Established common data analysis processes enabling problem identification, tracking, and evaluation to be conducted in a consistent manner across agencies.
  • Improved local agency and MPO safety analysis capabilities by providing user-friendly analysis tools.

The SHSP process requires data from a variety of sources to support the emphasis areas. If a central data source is not available, emphasis area teams may use conflicting data. When the safety data used by multiple agencies is inconsistent, tracking, evaluation, and problem identification are difficult.

To improve data consistency, Ohio created the Crash Statistics System (CSS), a single Statewide crash database for use by all agencies and the public. The CSS is managed by the Department of Public Safety (DPS), which is also responsible for license, citation, and vehicle registration data. The Ohio Enhanced Crash Location and Identification System (OECLIS), managed by the Ohio Department of Transportation (ODOT), uses the latest three years of crash data, which are merged with data on roadway characteristics and then analyzed to identify high-crash intersections and corridors. These databases support development of SHSP strategies and action plans.

A second element developed by ODOT, the GIS Crash Analysis Tool (GCAT), is an on-line GIS Web tool designed to enhance safety analysis capabilities. It allows users to extract crash data spatially and to create tables, charts, graphs, and collision diagrams based on the crash data selected from the map. The Crash Analysis Module (CAM) Tool is an Excel template that was built for the GCAT and helps facilitate common data analyses and queries, including crashes by day-of-week, light condition, weather condition, severity, and road condition.

State and local law enforcement agencies provide funds for data collection. ODOT staff cleans and maintains the data and provides data analysis support for metropolitan planning organizations (MPO) and local agencies. Ohio used §408 funds to develop the CSS portal.

Results

Ohio’s centralized process for safety data distribution has resulted in improved consistency in data analysis among all SHSP partners. Problem identification, tracking, and evaluation of safety progress have improved. The CSS, GCAT, and CAM Tool have increased local government and MPO access to crash data and enabled agencies to easily perform basic crash analyses.

Contact:
Jonathan Hughes, P.E.
Office of Systems Planning and Program Management
Ohio DOT
614-466-4019
jonathan.hughes@dot.state.oh.us

University Conducting HSIP Project Evaluations Using Empirical Bayes

Original publication: HSIP Noteworthy Practice Series, HSIP Project Evaluation; FHWA-SA-11-02; 2011(PDF, 2.3MB)


Wisconsin DOT contracted with the University of Wisconsin Traffic Operations and Safety (TOPS) Laboratory to investigate multiple project evaluation methods through a research grant for HSIP evaluation support. Initial research efforts included project evaluations based on before and after collision maps using the software Intersection Magic and before-after evaluations using benefit-cost analysis. From the beginning of the research, the intent was to use Empirical Bayes (EB) analysis in the project evaluations, but Wisconsin did not have safety performance functions (SPFs), which are required for the EB method. However, once the State acquired the SafetyAnalyst software, the TOPS Laboratory was able to incorporate the EB method into the project evaluations by using the SPFs contained in SafetyAnalyst. The SPFs in SafetyAnalyst were developed using national data and are intended to be calibrated to local conditions. While it was not possible to calibrate the SPFs to Wisconsin conditions due to lack of data, the TOPS Laboratory uses the SPFs to provide a comparison of performance in Wisconsin to that of the nation.

The TOPS Laboratory developed a process to extract the appropriate crashes (by location, type, and year) from the Wisconsin crash database based on the project location and scheduled start and completion dates for evaluation purposes. HSIP projects are evaluated based on five years of before data and three years of after data. Fatal and injury crashes are the focus of the evaluation, but the analysis also considers target crash types based on the nature of the improvement.

The TOPS Laboratory conducts a benefit-cost analysis based on results of both a simple before-after evaluation and an EB analysis to evaluate the projects from an economic perspective. This provides a simple comparison of the results of the two evaluation methods (In the table shown, “S. No.” refers to the site number for the project evaluated, and the “FOS (financial operating system) ID” is used by Wisconsin DOT as the specific project identifier.) and demonstrates how a simple before-after evaluation can overestimate the safety benefits.

Table 1. Benefit-Cost Analysis

S. No.FOS IDBenefit-Cost Analysis Using
Empirical Bayes Estimates
Benefit-Cost Analysis
Using Before-After Data
110220674
1.38
2.86
211504371
31.64
44.66
312060680
N/A
N/A
415300191
5.34
5.94
522001570
1.39
2.01
622401570
7.72
7.91
740500971
1.01
1.21
844790371
5.14
5.34
945401572
1.66
1.79
1046851471
1.22
1.24
1150600072
0.76
1.28
1252520071
1.04
2.21
1369960674
1.58
1.52
1469991072
-1.19
-0.86
1570300370
0.33
0.36
1672200191
13.09
14.66
1786100270
1.71
1.62
1886810571
1.44
1.47
1992000371
2.00
2.94

Key Accomplishments

  • Developed a project evaluation process incorporating Empirical Bayes analysis into all HSIP project evaluations.
  • Demonstrated the importance of using statistical evaluations to reduce the overestimation of safety benefits due to regression-to-the-mean bias.

Results

Originally, engineers in Wisconsin were reluctant to use EB. However, with the assistance of the TOPS Laboratory, the Wisconsin DOT was able to successfully implement a project evaluation process incorporating EB analysis and to receive buy-in at the regional level. The TOPS Laboratory demonstrated the importance of statistical EB techniques in project evaluations through a comparison benefit-cost analysis using simple before and after results to before and after using EB. The results demonstrate the EB analysis reduces the overestimation of safety benefits due to regression-to-the-mean bias.

Contact

Andrea Bill
Traffic Safety Engineering Research Program Manager
Traffic Operations and Safety (TOPS) Laboratory
University of Wisconsin
608-890-3425
bill@wisc.edu

Links to Existing Organizations

Original publication: SHSP Implementation Process Model, Supplement Number 1 – Case Studies; FHWA-SA-10-025; 2010(PDF, 1MB)


Key Accomplishments

  • Leveraged existing resources to implement SHSP action plans.
  • Engaged additional stakeholders in the SHSP action planning and implementation process.
  • Avoided duplication between SHSP implementation and other efforts.

Once the SHSP is developed, it is important to integrate SHSP implementation activities into the efforts of existing groups and coordinate with other implementation plans. In Maryland several safety Task Forces had been operating for a number of years prior to development of the SHSP. These included the Young Driver Task Force, Impaired Driving Coalition, Safety Belt Coalition, and Pedestrian Safety Coalition. SHSP leadership worked with these groups to include SHSP emphasis area strategies in their work plans.

Maryland also legislatively mandated a Task Force to Combat Driving Under the Influence of Drugs and Alcohol, which examined current impaired driving laws in the State and recommended improvements. The Impaired Driving emphasis area incorporated the work of this task force into its plan and leveraged the progress already made on impaired driving legislation. To strengthen implementation of the motorcycle section of the SHSP, Maryland used information from an existing motorcycle assessment performed by NHTSA to help develop the action plan for the Motorcycle Safety Emphasis Area. The NHTSA assessment was conducted by a team of experts from outside the State and provided a fresh look at the issue. Using the results of the assessment improved the action plan and avoided duplication of effort.

Results

Integrating SHSP implementation efforts into the work of existing task forces institutionalized the SHSP implementation process, avoided duplication of effort, and increased the number groups involved in implementation. SHSP action plans are now aligned with other State efforts enhancing coordination on action planning, ensuring seamless implementation of SHSP strategies, and increasing efficiency.

Contact:
Vern Betkey
Chief
Maryland Highway Safety Office
410-787-5824
vbetkey@sha.state.md.us

Data Analysis for County Highway Safety Plans

Original publication: HSIP Noteworthy Practice Series, Safety Data Collection, Analysis, and Sharing; FHWA-SA-11-02; 2011(PDF, 1.6MB)


The Minnesota Department of Transportation (MnDOT) has made $3.5 million available to develop Highway Safety Plans for each of the State’s 87 counties. The concept is to build on the foundation established by Minnesota’s Strategic Highway Safety Plan (SHSP), with the primary objective of identifying a specific set of safety projects directly linked to the causation factors associated with the most severe crashes on each county’s highway system.

The first step in developing each county plan has been to conduct a comprehensive crash analysis to disaggregate crashes by system (state or local), severity (serious injury, fatal), location type (urban or rural), and crash type. Through comprehensive crash analysis, MnDOT assisted counties with identifying whether the majority of the severe crashes are occurring on the state or local system and in urban or rural areas. This helps identify where the greatest proportion of crashes are occurring, as well as the primary crash types.

"County Roadway Safety Plan's Moving Towards ZERO Deaths logo"

The counties have then disaggregated the crashes based on the 22 emphasis areas identified by the American Association of State Highway and Transportation Official’s (AASHTO) to identify the critical emphasis areas (e.g., young drivers, seat belt usage, road departure, intersections). The identified emphasis areas represent the greatest potential to significantly reduce the number of severe and fatal crashes in the corresponding county.

Once emphasis areas were identified, an initial list of potential safety countermeasures was compiled using the strategies included in the National Cooperative Highway Research Program (NCHRP) 500 Series Reports – Guidance for Implementation of AASHTO’s SHSP. The county staff reviewed the initial list and eliminated strategies considered too expensive or experimental, and the remaining strategies were prioritized through a Safety Strategies Workshop, which included various safety partners in the county (e.g., public works, law enforcement, planning, public health, elected officials, MnDOT staff, etc.). During the workshop the results of the data driven analytical process were shared with the safety partners, who then discussed and prioritized the list of safety strategies.

Following the prioritization of safety strategies, a detailed crash analysis was conducted to identify contributing crash factors and characteristics based on the findings of the initial crash analysis. This analysis identified high risk locations (e.g., segments, horizontal curves, intersection) based on systemwide factors such as number of severe crashes, design features, traffic volumes, curve radius, etc.

In most cases the severe and fatal crashes have been spread over many miles of roadways, resulting in a low density of crashes. To address this issue, one of the key objectives of the county safety plans is to identify low-cost safety-related projects focused on the county’s identified emphasis areas to implement on a systematic basis. At this point in the process, projects were identified based on the results of the detailed crash analysis and the identified high-priority strategies. Some county lists of potential projects have included multiple years of projects – ultimately implementation will be dependent on securing HSIP funding or integration of these low cost measures into other programs such as 3R (Resurfacing, Restoring, Rehabilitation).

Key Accomplishments

  • Established a process for developing data-driven county safety plans.
  • Provided data analysis support to counties for improved problem and project identification.
  • Established a better link between crash causation and implementation of safety strategies on local roadways.

Results

As of December 2010, 23 counties have developed safety plans. The data analysis used to develop the plans has helped position counties to more effectively identify projects eligible for future HSIP funding cycles and to make improvements on local roadways with greater potential to reduce the number of fatal and serious injury crashes. The comprehensive data analysis has also positioned MnDOT to more subjectively quantify safety needs on the local roadways as part of the State’s systemic approach to safety improvements. Furthermore, through a process similar to the development of the statewide SHSP, development of county safety plans have fostered a greater safety culture among county stakeholders.

Contact

Brad Estochen
Minnesota Department of Transportation
651-234-7011
bradley.estochen@dot.state.mn.us

Local Government Assistance

Original publication: SHSP Implementation Process Model, Supplement Number 1 – Case Studies; FHWA-SA-10-025; 2010(PDF, 1MB)


Key Accomplishments

  • Established dedicated funding source for off-system safety improvements.
  • Distributed off-system safety funding to 103 counties.
  • Reduced off-system crashes.
  • Improved safety knowledge at the county and municipal level.

In 2005, Georgia represented nearly 20 percent of the total increase in motor vehicle fatalities nationally. The Georgia Department of Transportation (GDOT) had traditionally spent most of its safety dollars on improvements to State route intersections. However, approximately 36 percent of fatalities and 41 percent of crashes were occurring on off-system routes. The State realized it could not reach its goal of 1.0 fatalities per 100 million vehicle miles of travel by addressing on-system locations alone.

The State developed an off-system safety program in 2005 by providing each district $1 million per year dedicated to off-system safety projects. Each district hired an off-system coordinator (consultant) to manage the program. The off-system coordinators provide technical assistance and traffic engineering expertise to local governments to help identify projects and prepare cost estimates. GDOT and local governments entered into agreements enabling local governments to let and award their own projects. Some districts divide dollars evenly among counties based on need. Others require local participation to leverage funding. If districts are not able to prepare projects in time to obligate the full $1 million, remaining balances are distributed among the other districts. GDOT conducts spot inspections once work begins.

Program eligibility criteria were developed with input from FHWA, GDOT senior management, and district engineers. Eligible activities include:

  • Centerline raised pavement markers;
  • Shoulder, centerline, and edge line rumble strips;
  • Edge line (20 feet or wider roadways), centerline, and stop-bar pavement markings;
  • Signing;
  • Chevrons;
  • Vegetation removal;
  • Guardrail – excluding routine upgrades;
  • Guardrail delineation; and
  • Traffic signals if a crash warrant is met and adequate turn lanes exist.

Results

As a result of dedicated funding for off-system improvements, local jurisdictions have received increased technical assistance and traffic engineering expertise to identify projects and prepare cost estimates. County and city interest in identifying safety issues and making safety improvements has increased. Off-system safety improvements have reduced crashes in a number of SHSP emphasis areas.

Contact:
Kathy Zahul
Traffic Safety and Design
Georgia DOT
404-635-8134
kzahul@dot.ga.gov

Electronic Communication System

Original publication: SHSP Implementation Process Model, Supplement Number 1 – Case Studies; FHWA-SA-10-025; 2010(PDF, 1MB)


Key Accomplishments

  • Utilized existing communication tool that was easily implemented at no cost.
  • Established single Web site location to post documents, disseminate information, and communicate updates.
  • Reduced need for travel and face-to-face meetings while increasing level of information sharing.

In developing the SHSP and following up on its implementation, New Jersey needed a means to efficiently communicate with the members of its Safety Management Task Force. NJDOT wanted to establish a system enabling safety partners to post documents and resources, communicate information, and distribute updates on SHSP progress. A similar system had already been established on the Rutgers University Web site to facilitate student-faculty communication utilizing a free, open-source collaboration and courseware management platform. In partnership with NJDOT, Rutgers developed and hosted a Web-based communication system specifically for SHSP participants, utilizing the capabilities of the preexisting Web-based system.

The NJDOT safety coordinator directed specifications and design of the system. Once the concept was established, the university developed and launched the system within a week. No formal agreement between the State and Rutgers was necessary and no funding was required other than staff time to set up the system. This system supports communication among safety partners outside NJDOT, which is fundamental to the success of SHSP implementation.

While the system was designed to be a tool useful for educators, it has a wide range of components enabling group interaction. Project sites can be made publicly available or limited only to users invited to join. Some of the tools made available for the SHSP group were announcements, chat room, e-mail, e-mail archive, schedule, and resources. Each site incorporates an e-mail listserv so the site owner can communicate with the group easily, without having to manage large groups from personal e-mail accounts. One of the best features is the resources page that allows users to post documents to share with the group, negating the need for a separate FTP site.

Results

The electronic communication system provided an effective tool to keep SHSP partners informed and engaged, without being overbearing. The tool not only allows for the distribution of information but also for interaction and communication among partners, reducing the need to conduct time-consuming and expensive face-to-face meetings.

Contact:
Sarah Weissman
Program Manager
Transportation Safety Resource Center
732-445-0579, Ext. 135
scweiss@rutgers.edu