This section provides an overview of the wet weather crash problem, the purpose of this guide, the research methodology used, and the organization of this guide.
1.1 Wet Weather Crash Problem
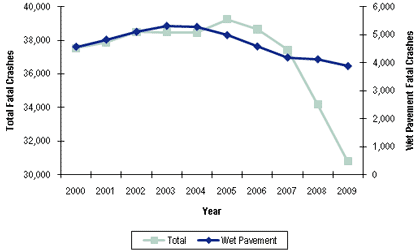
Between 2000 and 2009, there were a total of 371,104 fatal crashes in the United States; 46,811, or 12.6 percent, of these crashes occurred on wet pavement. Total fatal crashes and wet pavement fatal crashes for this 10-year period are illustrated in Figure 1.1. (Wet pavement fatal crashes in Figures 1.1 and 1.2 are based on crashes in the Fatality Analysis Reporting System (FARS) identified with a “wet roadway surface condition” variable in the police crash report. Other roadway surface conditions field variables include: blank, dry, snow/slush, ice/frost, sand/dirt/mud/gravel, water (standing or moving), oil, other, and unknown. These other variables are not included in the “wet” crash analysis.)
Figure 1.1 U.S. Total Fatal and Wet Pavement Fatal Crashes (2000-2009)

Source: Fatality Analysis Reporting System [1].
As shown in Figure 1.1, wet pavement fatal crashes have consistently decreased from a high of 5,308 in 2003 to a low of 3,881 in 2009, a 26.9 percent reduction. Total fatal crashes have also consistently decreased from a high of 39,252 in 2005 to a low of 30,797 in 2009, a 21.5 percent reduction.
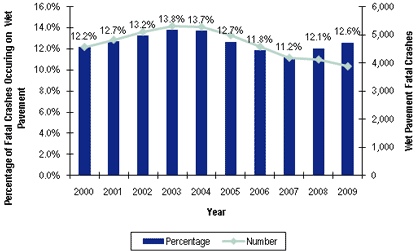
Figure 1.2 shows wet pavement fatal crashes as a percentage of all fatal crashes and the number of wet pavement fatal crashes. While the number of wet pavement fatal crashes has declined over the last several years, the percentage of fatal crashes occurring on wet pavement has increased the last couple of years.
Figure 1.2 Proportion of Fatal Crashes Occurring on Wet Pavement

Source: Fatality Analysis Reporting System [1].
According to research conducted by the Federal Highway Administration (FHWA) and the National Transportation Research Board (NTSB), a significant proportion of the wet pavement crashes occur on surfaces with inadequate pavement friction, and about 70 percent of wet pavement crashes could be prevented or minimized by improving pavement friction.
1.2 Purpose of This Guide
Following a motorcoach crash on Interstate 35 near Hewitt, Texas on February 14, 2003, the NTSB issued five safety recommendations to FHWA:
- H-05-12 – Issue guidance to your field offices describing the inadequate stopping sight distance that could occur when poor vertical geometries exist at locations with low coefficients of friction and speeds higher than the design speed and work with states to inventory such locations.
- H-05-13 – Once the locations in Safety Recommendations H-15-12 have been identified, assist the states in developing and implementing a plan for repaving or other roadway improvements.
- H-05-14 – Issue guidance recommending the use of variable speed limit (VSL) signs in wet weather at locations where the operating speed exceeds the design speed and the stopping distance exceeds the available sight distance.
- H-05-15 – Conduct research on commercial vehicle tire and wet pavement surface interaction to determine minimum frictional quality standards for commercial tires on wet pavement; once completed, 1) revise the tire requirements for commercial vehicle operating on wet pavement at highway speeds, and 2) develop minimum acceptable pavement coefficients of friction and maximum permissible pavement rut depths as part of roadway maintenance requirements, as appropriate.
- H-05-16 – Review state programs that identify and eliminate locations with a high risk of wet weather accidents and develop and issue a best practice guide on wet weather accident reduction.
This project was conducted in response to NTSB recommendation H-05-16. The project has two main objectives:
- Identification of state Department of Transportation (DOT) practices and procedures for improving pavement friction to reduce the occurrence of wet weather crashes; and
- Preparation of a best practice guide.
This report represents a guide that covers identification of wet pavement crashes, friction testing procedures, investigation, and remedial action of wet pavement crash locations, and project/program evaluations. It is based on the practices and procedures documented in five of those states, selected because of their well-established programs.
1.3 Research Methodology
A three-tiered approach was used to identify states with formal wet weather crash reduction programs. This approach involved outreach to FHWA Division Offices, review of the literature, and analysis of crash data.
Outreach
A message was posted on the FHWA Safety Exchange web site requesting FHWA Division Offices to respond if any of the states in their division had a formal program to address wet weather skidding crashes. Select FHWA Division Office personnel and colleagues were contacted directly to inquire about existing programs.
Literature Search
A literature scan was conducted to identify states with existing programs for reducing wet weather crashes. The review included reports published by FHWA, Transportation Research Board (TRB), National Cooperative Highway Research Program (NCHRP), American Association of State Highway and Transportation Officials (AASHTO), as well as individual state DOT documents such as Strategic Highway Safety Plans (SHSPs) and DOT web sites. A full scan of the literature found few examples of state programs focused on wet weather issues. Although most states describe some elements of a program to improve transportation safety by focusing on countermeasures for locations with wet weather skidding crashes, few states have comprehensively documented their policy or methods for identifying wet weather “hot spot” locations and evaluating the countermeasures applied.
Review the Data
Finally, wet weather fatal crashes provided in the Fatality Analysis Reporting System (FARS) and precipitation data provided by the National Climatic Data Center (NCDC) were reviewed. This information was used to identify states that appear to have made progress in reducing the number of wet weather crashes from a purely numerical standpoint. These states were considered for interviews. Many other and more complex factors may have had an impact on the reduction in wet weather crashes but are beyond the scope of this effort.
Interviews
Phone interviews were conducted with the following eight states identified with formal wet weather crash reduction programs:
- California;
- Florida;
- Kentucky;
- Maryland;
- Michigan;
- New Jersey;
- New York; and
- Virginia.
Each state provided information on when and why they began their wet weather crash reduction program, their program structure, procedures for identifying sites, mitigation techniques, and program results. The results of this research and the state interviews were documented for one of the tasks in this project.
1.4 Organization of This Guide
This guide is based on the four common components of wet weather crash reduction programs focused on friction improvements. These components include identification of wet pavement crashes, friction testing procedures, investigation and remedial action of wet pavement crash locations, and project/program evaluations. Section 2.0 describes each of these four components in detail and provides suggested procedures based on FHWA and AASHTO guidance on friction management programs. Section 3.0 provides case studies which outline the four common program components in California, Florida, Michigan, New York, and Virginia. Finally Section 4.0 provides a summary of the findings of this research effort.
