
SECTION 5: Data Collection and Analysis in Support of the HFST Program
This section discusses the data collection and analysis used for site selection and monitoring after HFST placement to assess the impact on crashes and HFST friction characteristics.
5.1 HFST Post-installation Crash Analysis
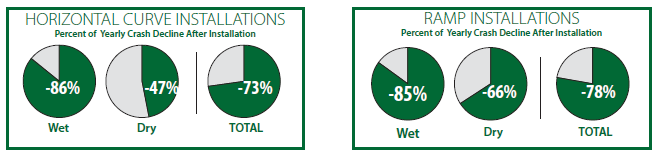
To assess the value of HFST, KYTC performed a post-installation crash analysis. The latest HFST crash analysis, conducted in October 2013, included 43 uniquely identified HFST installations on ramps and horizontal curves that were constructed between July 2009 and October 2012. Since the post HFST installation time frame is not adequate in length to perform a more rigorous analysis, a simple 3 year "before" installation to 1 to 4 years "after" installation7 crash comparison was performed. For horizontal curve installations yearly wet crash averages declined by 86 percent, yearly dry crash averages declined by 47 percent, and yearly total crashes declined by 73 percent. For ramp installations yearly wet crash averages declined by 85 percent, yearly dry crash averages declined by 66 percent, and yearly total crashes declined by 78 percent.
5.2 HFST Post-installation Friction Monitoring
As part of KYTC HFST post-installation assessment, there was interest in testing pavement friction on the HFST installations. KYTC conducts friction measurements with a conventional locked wheel skid trailer, but does not perform network-level friction testing. Friction testing is conducted for special requests and materials assessments. The majority of the HFST sites are in sharp horizontal curves, which are not conducive to testing with the locked wheel skid trailer.
KYTC selected the Dynamic Friction Tester (DFT) as the pavement friction testing device for HFST assessment. The Kentucky Transportation Center (KTC) was selected to provide the DFT testing services and prepare a written report. The DFT is a portable device that is suitable for testing pavement friction, but requires a lane closure. Friction data is collected in the inner and outer wheel paths as well as between the wheel paths. Testing is conducted at three locations per site: the beginning, the middle, and the end of the HFST installation. KTC personnel also document pavement distress and take photographs of each site. Unpublished reports documenting the testing conducted in 2012 and 2013 were developed. Some sites have little to no distress, while others display some raveling of the HFST aggregate and delamination of the epoxy-resin. Existing pavement transverse and longitudinal cracking have reflected through the HFST, which is expected. No moisture-trapping-related distresses have been observed. DFT values are consistent for most of the projects and are considered adequate. In 2012, the first year of DFT testing, approximately 80 sites were tested.