
1.1. The Challenges on Local Rural Roads
In 2008, the Fatality Analysis Reporting System (FARS) indicated that 56 percent of the 37,261 fatalities on U.S. roadways occurred in rural areas.1 Only 40 percent of all vehicles miles traveled nationally occur on rural roads, indicating the overrepresentation of severe rural traffic crashes.2
According to the Federal Highway Administration (FHWA), of the 8.4 million lane-miles of roads in the United States, over six million lane-miles are rural and more than two-thirds of these rural roads are owned and operated by local entities.3 Rural areas face a number of highway safety challenges. For instance, rural crashes tend to be at relatively higher speeds than urban crashes; more victims of fatal crashes in rural areas were not wearing a safety belt at the time of the crash; and it can take first responders longer to arrive at the scene of a rural crash, requiring victims to wait longer for medical attention. Another challenge is that the geometry of many rural roads was never truly designed; instead, these roadways evolved over time – from dirt to gravel to pavement – without design upgrades or other safety improvements. Additionally, roadside hazards such as utility poles or trees close to the roadway as well as steep pavement drop-offs can contribute to severe crashes on rural roads.
1.2. Local and Rural Guides
This document is part of a series developed by FHWA to specifically address the safety issues experienced on local rural roadways. It was developed to provide processes and examples for typical information needs and analyses local practitioners can use to help improve the safety of local rural roads. Its purpose is to acquaint local practitioners – regardless of background or experience level – with the information sources, calculations, tools, and methods to make data-supported decisions regarding local rural road safety.
Highway safety planning and policy decisions are generally made based on data gathered at the State, county, and municipal levels. Regulations for safety-related Federal funding and safety plan development require data for the decision making process. At the local level, these data requirements might seem daunting, particularly as they relate to funding and staff time needed for data collection, analyses, and overall assessments of safety improvements. It is important to note that a data-supported approach can increase the effectiveness of the distribution of limited funds to improve safety on local rural roads.
Once safety information is collected and needs are identified, analysis can further support practitioners during countermeasure selection. Practitioners can then choose strategies that target the areas of need based on analysis of crash types and other data. When applied directly to appropriate locations (both those with a history of crashes and those without a history but with a potential for future crashes), these targeted countermeasures can significantly improve traffic safety on the roadway network.
Figure 1 depicts the steps for the data collection and analysis process. This process includes determining which information sources will be used, extracting and storing the data as appropriate, and conducting the appropriate analyses. The final step is to periodically review crash data to determine emerging trends and to assess the effectiveness of installed countermeasures.
Data collection and analysis should be the base of the safety management process. The importance of data should be clearly emphasized throughout all stages of a project's life cycle.
Figure 1. Data Collection and Analysis Steps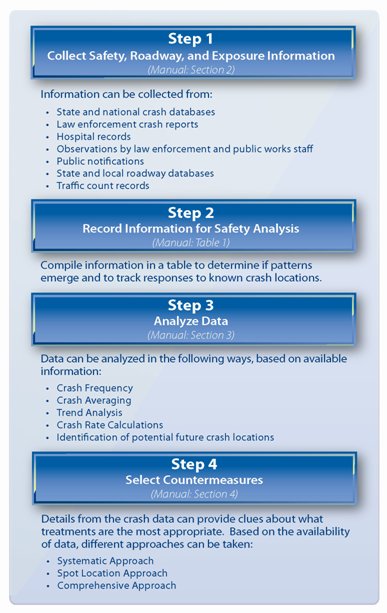
1 National Highway Traffic Safety Administration, Traffic Safety Facts: 2008 Data (Washington, DC: 2009). Available at http://www-nrd.nhtsa.dot.gov/Pubs/811164.pdf. [ Return to note 1 ].
2 Safe Transportation Research and Education Center (SafeTrec), Institute of Transportation Studies, University of California-Berkley, "Rural Road Safety website." Available at https://safetrec.berkeley.edu/. [ Return to note 2 ]
3 U.S. Department of Transportation, Federal Highway Administration, Functional System Data: Lane-Miles by Functional System, Highway Statistics Series, October 2008. Available at https://www.fhwa.dot.gov/policyinformation/statistics/hm60.cfm?hm_year=2007. [ Return to note 3 ]
![]() You may need the Adobe Reader to view the PDFs on this page.
You may need the Adobe Reader to view the PDFs on this page.