USA Banner

Official US Government Icon

Official websites use .gov
A .gov website belongs to an official government organization in the United States.

Secure Site Icon

Secure .gov websites use HTTPS
A lock ( ) or https:// means you’ve safely connected to the .gov website. Share sensitive information only on official, secure websites.

U.S. Department of Transportation U.S. Department of Transportation Icon United States Department of Transportation United States Department of Transportation

Noteworthy Practices

Left Nav - HSA Learn Safety

Blocked Crossings on Local Roadways in Jackson, MS and Kirkwood, MO


Describe the roadway safety situation or state before the new practice was implemented. What was the safety issue, problem, or gap?

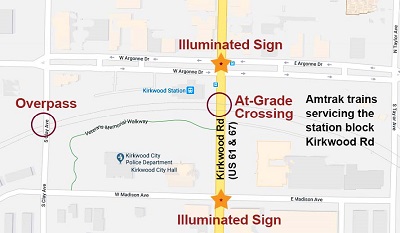
"map of Kirkwood, marked to show the locations of an Overpass, two Illuminated signs, and an At-Grade Crossing"

A main arterial road in Kirkwood, MO features an at-grade crossing where regularly scheduled freight and passenger trains block traffic. On average, 28 trains go through Kirkwood every day, and four of those are passenger trains causing extended closures while passengers embark and disembark. This blocked crossing causes traffic to back up quickly and form queues on the main road.

In Jackson, MS, a railroad crossing bisects an interstate off-ramp caused exiting traffic to back up onto the interstate when a train was present. Impatient drivers often tried to “beat the train,” causing damages to the gates from near misses. Because there is no turn-off or alternative route once a vehicle exits the interstate via the off-ramp, a proactive solution to re-route traffic while it was still on the interstate was necessary.

What were the key challenges that needed to be addressed before the new practice could be implemented?

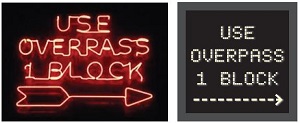
"two signs (neon and DMS) that each read: Use Overpass | 1 Block"

Both Jackson and Kirkwood had very limited budgets and needed to find a low cost solution that would direct drivers to alternate routes around a blocked rail-highway crossing. Communicating blocked route information to drivers in a practical, economical way was the focus of the cities’ efforts.

Describe the new practice.

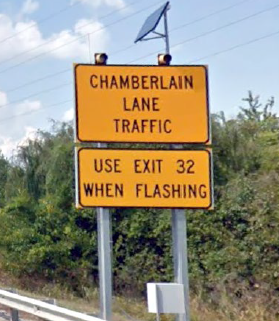
In Kirkwood, a sign was installed to direct drivers away from the blocked crossing. The existing sign is in the process of being upgraded with a project that will include actuated signals, new controllers, and actuated warning signs that use light-emitting diode technology and are compliant with the Manual on Uniform Traffic Control Devices.

"sign: Chamberlain Lane Traffic | Use Exit 32 When Flashing"

In Jackson, a static sign reading “expect train when flashing” is illuminated by flashing lights and activated by approaching trains to tell motorists to divert to the next exit.

What technical and/or institutional changes resulted from the new practice?

Installation of these train-actuated signs served to inform drivers in both cities to use the designated alternate route. Both are examples of an effective, low-cost solution for redirecting traffic when a crossing is blocked.

What benefits were realized as a result of the practice?

In Kirkwood, the city engineer estimates that approximately 1,000 vehicles per day detour to the nearby overpass rather than risk being stopped at the blocked crossing.

In Jackson, MS, an estimated 95 percent of daily, local traffic is exposed to the warning message and has the option to divert to an alternative exit.

Contact

Kelly Morton
FHWA Office of Safety Programs
(602) 382-8976
Kelly.Morton@dot.gov

Tailoring Safety Audits for Rail-Highway Crossings


Describe the roadway safety situation or state before the new practice was implemented. What was the safety issue, problem, or gap?

With more than 7,000 rail-highway grade crossings in the State, California needed an approach that would prioritize and treat the crossings in greatest need of safety improvements and leverage the common goals of California’s many rail safety partners.

What were the key challenges that needed to be addressed before the new practice could be implemented?

In California, the Section 130 program is a cooperative effort between the Federal Highway Administration (FHWA), California Department of Transportation (Caltrans), California Public Utilities Commission (CPUC), railroad companies, and local agencies. It is the responsibility of CPUC to select crossings for inclusion in the statewide funding program based on their potential safety issues. To determine which crossings meet the requirements, CPUC staff must first analyze the available data on each crossing, including crash history, any safety concerns voiced by nearby residents or businesses, and near-miss data from railroads. Based on this data analysis process, crossings are then selected and scheduled for field reviews. Once complete, CPUC uses the results of the field reviews to identify and prioritize crossings for treatment under the Section 130 program.

Describe the new practice.

To ensure the crossings in need of treatment are prioritized properly and treated effectively, CPUC developed a two-phase process. The first phase uses a data-based analysis to identify and rank crossings with potential safety issues, and the second involves conducting a rail-highway diagnostic review to determine the specific safety needs of the highest ranked crossings.

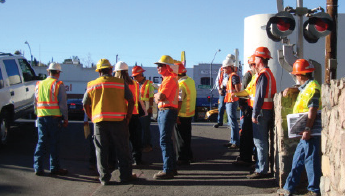
"Field Diagnostic Team"

Based on available data, a prioritized list that ranks locations is developed based on factors including accident history and trends, vehicle and train volumes, pedestrian issues, and geometry. Potential projects are selected based on their rank on the list. The second phase involves a Field Diagnostic Team—which consists of representatives from the railroad company(s), local agency(s), Caltrans, CPUC staff, and other rail safety partners as appropriate (for example, FHWA Division Office staff). The Field Diagnostic Team conducts a diagnostic review, where the crossing is observed and vehicle behaviors and potential issues, along with pedestrian safety concerns, are identified. The diagnostic team then develops a summary of their findings which includes options for improvement. The CPUC prioritizes the reviewed crossings and treats the highest ranked ones as funding allows.

What technical and/or institutional changes resulted from the new practice?

There is a lot of preparation work to support diagnostic reviews. A structured review begins with a group review of the data for each crossing. Then the field visit begins with a safety briefing and an overview of the process the team will use to review the site. The diagnostic team first reviews vehicle behaviors and potential issues, then turns their attention to pedestrian safety concerns.

At end of the review, the Field Diagnostic Team develops a summary of their findings, including any suggested safety options or improvements. Once all the diagnostic reviews for the year are completed, CPUC selects the highest ranked crossings for treatment based on the funding anticipated to be available. CPUC then develops individual project packages for Caltrans, including a scope of work, conceptual plans, project development report, project timeline, and a cost estimate. The project packages, along with a final priority list, are then submitted to Caltrans for programming, environmental clearance, right-of-way certification and, ultimately, funding.

What benefits were realized as a result of the practice?

The California diagnostic review process is a success because CPUC and Caltrans have been able to install treatments at locations selected for improvement based on data analysis. As a result, California applied robust safety improvements that address a rail-highway crossing from a holistic safety perspective, eliminating lingering safety issues that would require additional reviews year after year.

Contact

Bree Arnett
California Public Utilities Commission
Bree.Arnett@cpuc.ca.gov

Overcoming Limited Data to Identify High Risk Rural Road (HRRR) Projects


Describe the roadway safety situation or state before the new practice was implemented. What was the safety issue, problem, or gap?

Kansas recognized a gap between the data needed to identify safety projects that qualified for High Risk Rural Road funding and the data available. The limited data they did have pointed to a need for a program that reduced roadway departures in order to decrease collisions with fixed objects, which is the most common rural fatality crash type in the State.

What were the key challenges that needed to be addressed before the new practice could be implemented?

Without detailed data, Kansas was having difficulty identifying projects that qualified for High Risk Rural Road project funding. Statewide data revealed crash problems, but a lack of site-specific rural road data, along with the randomness of crashes on county roads, restricted the agency’s ability to complete data-driven analysis for specific locations.

Describe the new practice.

"collage of photos: SafetyEdgesSM preparation and installation, a tree-lined roadway, a pickup truck, and yellow signs with Bear Right arrows along a curving road"

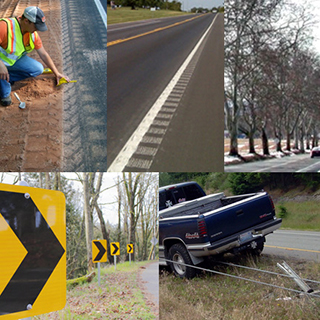
Kansas Department of Transportation (KDOT) staff realized a systemic safety approach would enable them to use High Risk Rural Road funding to apply low-cost treatments systemically on county roads that shared common crash risk factors, effectively improving safety in those locations.

KDOT has funded widespread installation of low-cost countermeasures such as the SafetyEdgeSM, pavement markings, rumble strips, tree removal, enhanced signing, and improvements to roadside barriers such as culvert headwalls and guardrails.

What technical and/or institutional changes resulted from the new practice?

The new approach became the foundation for the way KDOT identifies and programs projects to be treated through High Risk Rural Road funding.

Institutionally, teamwork had to become a priority for this practice to succeed. The process of identifying sites for treatment includes input from and coordination with local agencies, the Local Technical Assistance Program, the FHWA Division Office Safety Engineer, a metropolitan planning organization, the Kansas association of counties, as well as county police and emergency response representatives.

What benefits were realized as a result of the practice?

Focusing its high risk rural road funding through a systemic approach has allowed Kansas to invest in extensive low cost countermeasures since 2011.

KDOT considers the ever-increasing popularity of the program among the counties to be a sign that the program is successful. In addition, local agencies have expressed that this approach is adding value to their system by increasing safety.

Contact

Steven Buckley
Kansas State Bureau of Transportation Safety & Technology
Steven.Buckley@ks.gov

Empowering the Community to Achieve Consensus


Describe the roadway safety situation or state before the new practice was implemented. What was the safety issue, problem, or gap?

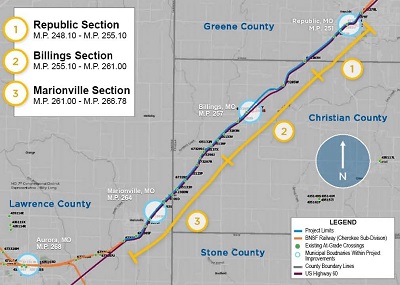
In Missouri, a rural corridor with 29 at-grade crossings experienced 62 incidents since 1975, including 14 fatalities and 19 injuries. Although the Missouri Department of Transportation (MoDOT) had previously suggested crossing closures as a means of increasing safety, many citizens who live in communities along the corridor use these crossings to access other sections of their towns and were initially resistant to crossing closures. MoDOT was struggling to reach consensus with local officials and communities on a solution.

What were the key challenges that needed to be addressed before the new practice could be implemented?

After unsuccessful attempts to reach a consensus, MoDOT realized it would need a new approach that would not only improve safety, but also fully address residents’ concerns.

Describe the new practice.

"map of a section of Lawrence, Greene, Christian, and Stone counties in Missouri"

In January 2017, MoDOT commissioned a rail corridor safety study to:

  • Evaluate all rail-highway crossings within the corridor.
  • Provide streamlined solutions to increase safety.
  • Deploy a public input process that would bring about community support for effective, collaborative consolidation and safety improvement recommendations.

To oversee the public input process, MoDOT hired a consultant to act as a neutral third party. The consultant’s approach was first to listen to the citizens’ perspectives, then present a series of alternative treatments MoDOT had identified for each crossing site. Each of the alternatives presented also included the results of a benefit-cost analysis. The consultant presented each option and let the communities vote on which to apply.

What technical and/or institutional changes resulted from the new practice?

As a result of this success, the MoDOT Rail Section is considering using this approach at another location along a similar length of railroad to engage the small rural communities along the corridor in building a consensus for safety improvements.

What benefits were realized as a result of the practice?

As a result of gaining public approval to proceed with safety treatments, once complete, the five proposed closures along with the many upgrades and site improvements throughout the corridor will allow for 23 fewer crashes, with 1.41 fewer fatal crashes, 7 fewer injury crashes, and 15 fewer non-injury crashes over a 25-year period as compared with the baseline estimates.

Contact

Chris S. Brownell
Missouri DOT
Sidney.Brownell@modot.mo.gov

Ohio Economic Crash Analysis Tool (ECAT) Supports Benefit-Cost Analysis

Publication Year: 2017


Background

The Ohio Department of Transportation (ODOT) uses a data-driven approach to identify, screen, and prioritize potential highway safety improvement projects. ODOT analyzes crash, roadway, and traffic data to identify sites with potential for safety improvement. Typically, ODOT studies up to 300 locations annually across the State. ODOT District offices and local agencies diagnose safety issues at these locations and develop targeted countermeasures to address the underlying crash contributing factors. The District offices develop funding applications for safety projects and submit the applications to the Central Office for further consideration. Multidisciplinary committees review and evaluate the project applications based on factors such as crash analysis; statewide, regional or local priority; matching funds; and benefit-cost analysis.

Each year, ODOT reviews approximately 70 applications for safety improvement projects. While ODOT spends more than $100 million annually on highway safety improvement projects, the funding requests total more than $150 million. As such, there is a need to prioritize those projects with the greatest potential for reducing crashes.

Solution

To support the highway safety project prioritization process, ODOT developed the Economic Crash Analysis Tool (ECAT). ECAT supports analysts in estimating the safety performance of a given facility (existing or proposed), conducting alternatives analyses, and completing a benefit-cost analysis. This tool automates much of the analysis, simplifying the process and allowing people with various skill levels to use the tool and make better safety investments.

In developing ECAT, ODOT reviewed available spreadsheets such as those developed for the implementation of the Highway Safety Manual (HSM). This provided the foundation for the underlying safety performance calculations. To simplify the process, ODOT combined multiple HSM-related spreadsheets into a single spreadsheet.

Using ECAT for benefit-cost analysis, the user selects the site type and enters basic project information such as costs and safety benefits. The user can specify various costs, including the initial construction cost, operating and maintenance costs, and salvage value. Analysts use other supporting modules in ECAT to estimate the safety benefits in terms of change in predicted and expected crashes. The tool provides default values for inputs such as the projected service life. Based on the user inputs for costs and benefits, the tool computes the present value costs and benefits based on a discount rate of 4.0 percent.

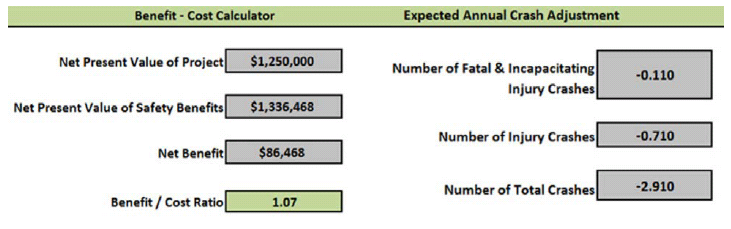
The following figures provide examples of outputs from the benefit-cost analysis module in the ECAT tool. Figure 1 shows an example of the economic analysis summary table from ECAT, which indicates the net present value of the project (i.e., present value cost), the net present value of safety benefits (i.e., present value benefit), net benefit (i.e., present value benefit minus present value cost), and benefit-cost ratio (i.e., present value benefit divided by present value cost). The summary table also indicates the expected annual crash adjustment in terms of the change in the number of fatal and incapacitating injury crashes, change in the number of all injury crashes, and the change in total crashes.

"Figure 1. Sample economic analysis summary tables from ECAT."

Figure 1. Sample economic analysis summary tables from ECAT.

Figure 2 shows an example of the economic analysis summary charts from ECAT. The upper left chart presents a summary of the combined projected cash flows by countermeasure by year. Negative cash flows represent an expenditure (greater investment than return) and positive cash flows represent a return on investment. The middle chart presents a summary of cash flows by year for project costs only. This example shows an initial project cost in year 0, and either maintenance or rehabilitation costs in years 5, 10, and 15. The bottom right chart shows the return on investment (i.e., cumulative annual benefits minus cumulative annual cost). Users can quickly identify the breakeven year as the first year with a positive return on investment. In this example, the breakeven year is year 8.

"Sample economic analysis summary charts from ECAT."

Figure 2. Sample economic analysis summary charts from ECAT.

Sources

Traffic Academy Safety Studies & Freeway Safety Study Guidelines
Ohio Department of Transportation, 2017

Highway Safety Manual
Ohio Department of Transportation
Division of Planning
Office of Systems Planning and Program Management, February 2017

Contact

Tim McDonald
Ohio Department of Transportation
Office of Planning
Tim.Mcdonald@dot.ohio.gov
(614) 466-4019

Resources

ODOT requires the use of ECAT for all safety studies completed on the State highway system. To support users, ODOT posts examples and help files along with the tool on the ODOT Highway Safety Improvement Program website. ODOT posts enhancements and updates to the tool with release notes documenting changes.

The tool and supporting documentation are available from the Office of Systems Planning and Program Management, Highway Safety Manual Data Analysis Tools webpage. (This page is no longer available.)

FDOT’s Transportation Value to You (TransValU) Supports Benefit-Cost Analysis

Publication Year: 2017


Background

Transportation agencies are often faced with difficult decisions and need to answer questions like “which transportation project will provide the greatest return on investment?” To answer such questions, there is a need to quantify and compare the relative benefits and costs of project alternatives.

Solution

The Florida Department of Transportation (FDOT) District Five created a tool to perform economic analysis and address such questions. Transportation Value to You (TransValU) is a spreadsheet-based tool designed for corridor-level economic and financial analyses of proposed transportation investments. FDOT District Five uses the tool to assess projects focused on passenger movements, including highway, transit, bicycle/pedestrian, and combinations of these modes. The District also uses the tool to assess projects related to the movement of goods, including highway freight, rail freight, and intermodal logistics centers.

Three types of analyses are available within the tool: Benefit-Cost Analysis (BCA), Economic Impact Analysis (EIA), and Financial Analysis. For the BCA and EIA, the tool includes separate modules for the analysis of projects focused on passenger movements and projects focused on goods movements. There is only one module for financial analysis, which is the same for all project modes.

Benefit-Analysis Module

The purpose of BCA is to monetize as many of the costs and benefits of a project, program, or policy as possible. This involves quantifying the benefits and costs of an alternative relative to a base condition to determine whether the net benefits of a project outweigh the costs. TransValU provides a framework to quantify all capital, operating, and maintenance costs, as well as a wide range of benefits. TransValU provides results to help identify the alternative or mix of alternatives that maximizes net benefits or social welfare per dollar invested. The tool provides a side-by-side comparison of multiple alternatives through performance measures such as net present value, benefit-cost ratio, overall rate of return, and discounted payback period.

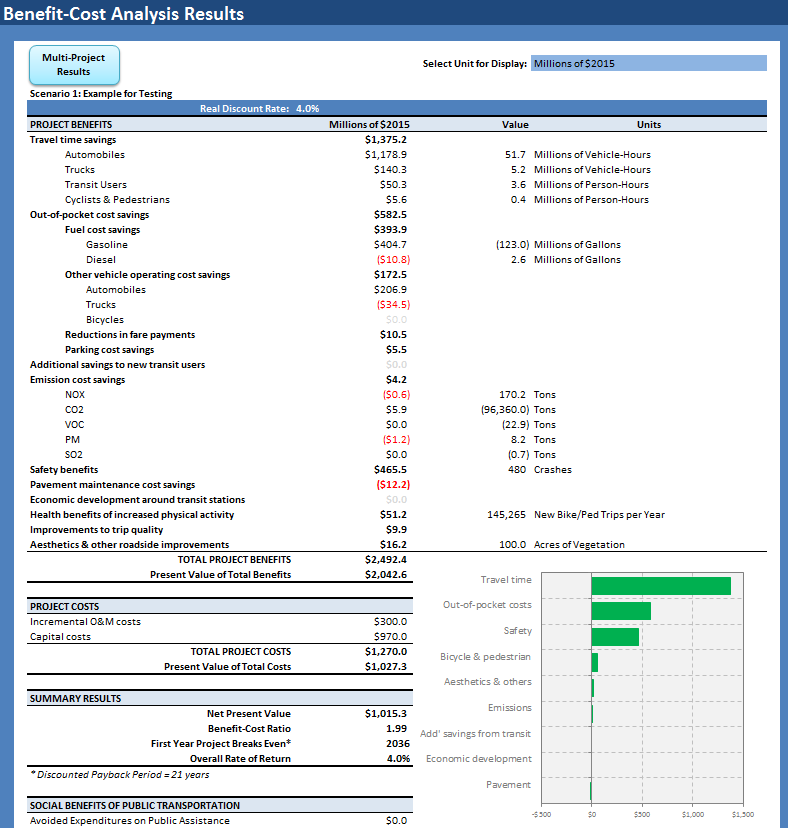
Figure 1 shows an example of the output from a BCA generated with TransValU. The project benefits include the travel time savings, out-of-pocket cost savings (e.g., fuel use, parking, etc.), emissions cost savings, safety benefits, pavement maintenance cost savings, economic development near transit stations, health benefits, improvements to trip quality, and aesthetic improvements. Notice the difference in project benefits among the various factors. For example, the safety benefits represent approximately 20 percent of the total project benefits. These benefits are plotted in the lower right of the figure to show the relative contribution of each factor. The project costs include the capital costs and continuing operations and maintenance (O&M) costs. Both the benefits and costs are converted to present value using the selected discount rate. The summary provides the net present value, benefit-cost ratio, overall rate of return, and discounted payback period. In this case, the discounted payback period is 21 years, and the figure notes the first year the project is projected to breakeven is 2036.

"Screenshot of BCA output from TransValU"

Figure 1. Sample BCA output from TransValU.

Economic Impact Analysis Module
The purpose of the EIA module is to assess the effects of a project, program, or policy on the economy of a state or region, focusing on changes in economic activity. Economic impacts are expressed as changes in business sales (output), gross regional product (GRP) or “value added,” employment, and earnings. TransValU estimates the short-term economic impacts resulting from spending on transportation projects. Long-term economic impacts are also estimated for freight projects. These are lasting impacts resulting from improvements to a transportation facility.

Financial Analysis Module
The financial analysis module focuses on the flows of money to and from a project or organization, typically a firm or government agency. It helps identify the project or alternative that maximizes net inflows (e.g., total revenue minus total expenses). A financial analysis from the perspective of a government agency looks at the impacts of a project on government expenditures and receipt.

Benefits

TransValU helps to assess the impacts of capital projects based on changes in any of the following variables:

  • Changes in the number of crashes by severity resulting from projects that reduce the likelihood of crashes at a specific location and/or projects that entice travelers to use relatively safer modes.
  • Changes in vehicle miles traveled (VMT) and/or vehicle hours traveled (VHT) from highway investments and/or spending in other modes affecting highway travel through modal shifts.
  • Changes in the number of transit riders and/or the average transportation costs borne by transit riders, including in-vehicle travel time, waiting time, and fares.
  • Changes in the number of bicycle users or pedestrians and/or changes in their average door-to door travel times.
  • Changes in the percent breakdown of the transit vehicle fleet (e.g., diesel, hybrid, compressed natural gas, or electric buses and trains).
  • Changes in the extent of roadside aesthetic improvements, expressed as additional acres of vegetated right-of-way.
  • Changes in freight rail movements or volumes of goods handled at an integrated logistics center.

While the tool was developed by FDOT District Five, it provides the ability to perform district-level analysis for other FDOT districts. It also provides the ability to perform county level analysis, but only within District Five.

The BCA modules are consistent with the USDOT guidance for TIGER and FASTLANE grant applications. This includes methods for the valuation of impacts related to safety, travel time, and emissions. It also supports the estimation of benefits from investments in pedestrian and bicycle facilities. Using the results, agencies can make more consistent and informed decisions when developing policy or comparing and selecting project or program alternatives.

Sources

Refer to the following link for further information on the tool.
http://cfgis.org/FDOT-Resources/TransValU.aspx

Contact

Central Florida Geographic Information Systems
455 N. Garland Ave. 
Suite 414
Orlando, FL 32801
Tara McCue, Director of Planning
tara@ecfrpc.org
407-245-0300

Caltrans CAL-B/C Tool Supports Benefit-Cost Analysis for Highway and Transit Projects

Publication Year: 2017


Background

The California Department of Transportation (Caltrans) must continuously justify the economic effectiveness of their programs and expenditures. In selecting among alternative projects and programs, there is a need to quantify and compare factors such as safety performance, pavement preservation, operational performance, and environmental impacts. Benefit-cost analysis (BCA) supports these decisions by quantifying life-cycle costs and benefits, which helps to understand the potential return on investment from alternative projects and programs. While Caltrans routinely quantifies and compares project costs and benefits, there was a need to automate the calculations to improve the efficiency and consistency of analysis.

Solution

Caltrans developed the Cal-B/C tool for BCA of highway and transit projects. It is an Excel spreadsheet application structured to analyze transportation improvement projects in a corridor where there already exists a highway facility or a transit service (the base condition). The tool calculates benefits for existing and (optionally) for induced traffic, as well as for any traffic diverted from a parallel highway or transit service. It estimates benefits separately for peak and off-peak periods as well as for high occupancy vehicle (HOV) and non-HOV passenger vehicles and trucks.

Analysts can use the tool to evaluate highway projects such as general improvements, HOV and passing lanes, interchange improvements, and a bypass highway. Transit projects may include new or improved bus services, with or without an exclusive bus lane, light-rail, and passenger heavy-rail projects. Analysts can evaluate a proposed highway or transit project independently or in the presence of the competing mode, in which case the tool estimates the benefits to diverted traffic.

For costs, the analyst can enter the total life cycle investment and annual operating and rehabilitation costs. The tool considers the following categories of benefits:

  • Travel time.
  • Safety (both highway and transit).
  • Vehicle operating costs (for highway users).
  • Emissions (CO, NOx, PM10, VOC) (optional output).

The tool provides the following economic performance measures:

  • Net present worth.
  • Benefit-cost ratio.
  • Internal rate of return.
  • Payback period.

Example Application

Description and Purpose of Project

The Commercial Vehicle Information Systems and Networks (CVISN) Program seeks to expand electronic credentialing and screening of commercial vehicles to improve safety and efficiency. CVISN is intended to enhance the safety and efficiency of commercial vehicles nationwide. Benefits include lower costs for vehicle credentialing and operations and more effective safety inspections. Trucks with good safety records save time by bypassing inspection stations at highway speeds. The public benefits from the program through decreased energy consumption and noise pollution. In addition, a more effective inspection system will result in safer commercial vehicles on the road and thus fewer heavy truck accidents.

Alternatives Considered

For this study, a benefit-cost analysis was conducted separately for two CVISN components, roadside enforcement and electronic credentialing.

For roadside enforcement, the analysis included three alternatives. The first was an upgrade of inspection station computer systems, but without electronic screening. The second was an upgrade from the first scenario to electronic screening and additional station improvements. The third, treated as a sensitivity analysis, entailed the same as the second, with the added assumption that the motor carrier safety regulation violation rate will decrease by 25 percent.

For electronic credentialing, the analysis included two alternatives. The first was electronic credentialing for states not using the Vehicle Information System for Tax Apportionment (VISTA). The second was electronic credentialing for those states currently using VISTA.

Results

Table 1 shows the results of the BCA for the three roadside enforcement scenarios. The benefits include crashes avoided and transit-time savings. The costs include the startup costs, replacement costs, operating costs to states and carriers, and out-of-service costs to carriers. The total value of the benefits and costs are in 1999 U.S. dollars discounted at 7 percent. From these results, it is apparent that the upgrade to electronic screening (scenario 2) provides a net benefit with a net present value of $2,665,400,000 and a benefit-cost ratio of 2.0, indicating a return of $2 for every $1 spent. If this results in a reduction in the rate of motor carrier safety regulation violations (scenario 3), then this project would return even greater benefits. Notice how the value of crashes avoided compares to the value of travel time savings for the three scenarios.

Table 1. Benefit-Cost Analysis for Roadside Enforcement Scenarios.

Benefits and CostsScenario 1Scenario 2Scenario 3

Benefits

Crashes avoided

$69,076,000

$484,300,000

$8,178,000,000

Transit-time savings (including operations and maintenance as well as air and noise pollution)

$0

$4,817,000,000

$4,817,000,000

Total benefits

$69,076,000

$5,301,300,000

$12,995,000,000

Costs

One-time startup costs to states

$30,980,000

$99,500,000

$99,500,000

Replacement capital costs to states

$51,208,000

$86,400,000

$86,400,000

Increased operating costs to states

$9,512,000

$178,700,000

$178,700,000

Increased operating costs to carriers

$0

$2,131,900,000

$2,131,900,000

Increased out-of-service costs to carriers

$19,891,000

$139,400,000

$104,500,000

Total Costs

$111,591,000

$2,635,900,000

$2,601,000,000

Net Present Value

-$42,515,000

$2,665,400,000

$10,394,000,000

Benefit/Cost Ratio

0.62

2.0

5.0

Table 2 shows the results of the BCA for the two electronic credentialing scenarios. The benefits include operating cost savings to state and carriers as well as inventory cost savings to carriers. The costs include the startup costs and replacement costs to states. The total value of the benefits and costs are in 1999 U.S. dollars discounted at 7 percent. From these results, it is apparent that the upgrade to electronic credentialing provides a net benefit whether implemented in states with or without VISTA. The greatest net benefit is to those states not using VISTA with a net present value of $513,220,000. The return on investment is greatest for those using VISTA with a benefit-cost ratio of 40.4.

Table 2. Benefit-Cost Analysis for Electronic Credentialing Scenarios.

Benefits and CostsScenario 1Scenario 2

Benefits

Operating cost savings to states

$257,900,000

$240,800,000

Operating cost savings to carriers

$56,700,000

$18,600,000

Inventory cost savings to carriers

$243,100,000

$79,900,000

Total Benefits

$557,700,000

$339,300,000

Costs

One-time startup cost to states

$42,140,000

$7,200,000

Replacement capital costs to states

$2,340,000

$1,200,000

Total Costs

$44,480,000

$8,400,000

Net Present Value

$513,220,000

$330,900,000

Benefit/Cost Ratio

12.5

40.4

Source

Brand, D., T. E. Parody, J. E. Orban, and V. J. Brown. "Benefit-Cost Analysis of the Commercial Vehicle Information Systems and Networks Program." Transportation Research Record: Journal of the Transportation Research Board, No. 1800, TRB, National Research Council, Washington, D.C., 2002. pp. 35-43.

Contact

CalTrans Office of State Planning, Transportation Economics Branch
Rose Agacer (rose.agacer@dot.ca.gov), Economist for the Transportation Economics Branch

Oregon DOT Implements Two New Tools that Evaluate Asset Condition and Efficiently Manage Maintenance Efforts


Background

With almost 20,000 lane miles on the Oregon highway system, the Oregon Department of Transportation (ODOT) is responsible for managing and maintaining its roadway assets. Managed assets include barriers, traffic signals, lighting, pavement markings, and signs. ODOT has developed an inventory of its assets and evaluates asset condition in order to efficiently manage maintenance efforts. Over several years, ODOT implemented two new programs to manage their roadway assets, TransInfo and the Features, Attributes, and Conditions-Statewide Transportation Improvement Program (FACS-STIP) Tool. TransInfo is a statewide asset management system. It provides ODOT asset management staff with the most up-to-date statistics on assets and other features on the State highway system. The FACS-STIP Tool is a web-based program that provides information on an asset’s location, attributes, and condition to all users with internet access.

Read the Case Study Asset Management in Oregon for more detailed information.

SEMCOG’s Innovative Traffic Data Quality Assurance/Quality Control and Automated AADT Estimation Reduce Labor Costs Associated with Converting and Entering Data


Background

This case study highlights two noteworthy practices at the Southeast Michigan Council of Governments (SEMCOG) regarding short-duration traffic count validation procedures and an automated annual average daily traffic (AADT) estimation process. SEMCOG maintains a centralized traffic count database and receives traffic counts from the local agencies in southeast Michigan. SEMCOG conducts 46 validity checks on all traffic count data to identify invalid data available in the database but not adequate for analysis. After implementing the system, SEMCOG reduced labor costs associated with converting and entering data and was able to spend more time analyzing data. SEMCOG developed an algorithm that works inside its geographic information system (GIS) to improve AADT estimates by searching for uncounted segments with nearby counted segments. When a counted segment is identified, the algorithm calculates the weighted average of two nearby segments and assigns that AADT to the uncounted segment. This process was automated using Python scripts, which results in an increase in the number of AADT estimates without requiring additional field data collection.

Read the Case Study Southeast Michigan Council of Governments: Innovative Traffic Data Quality Assurance/Quality Control Procedures and Automating AADT Estimation for more detailed information.